Figure 1:

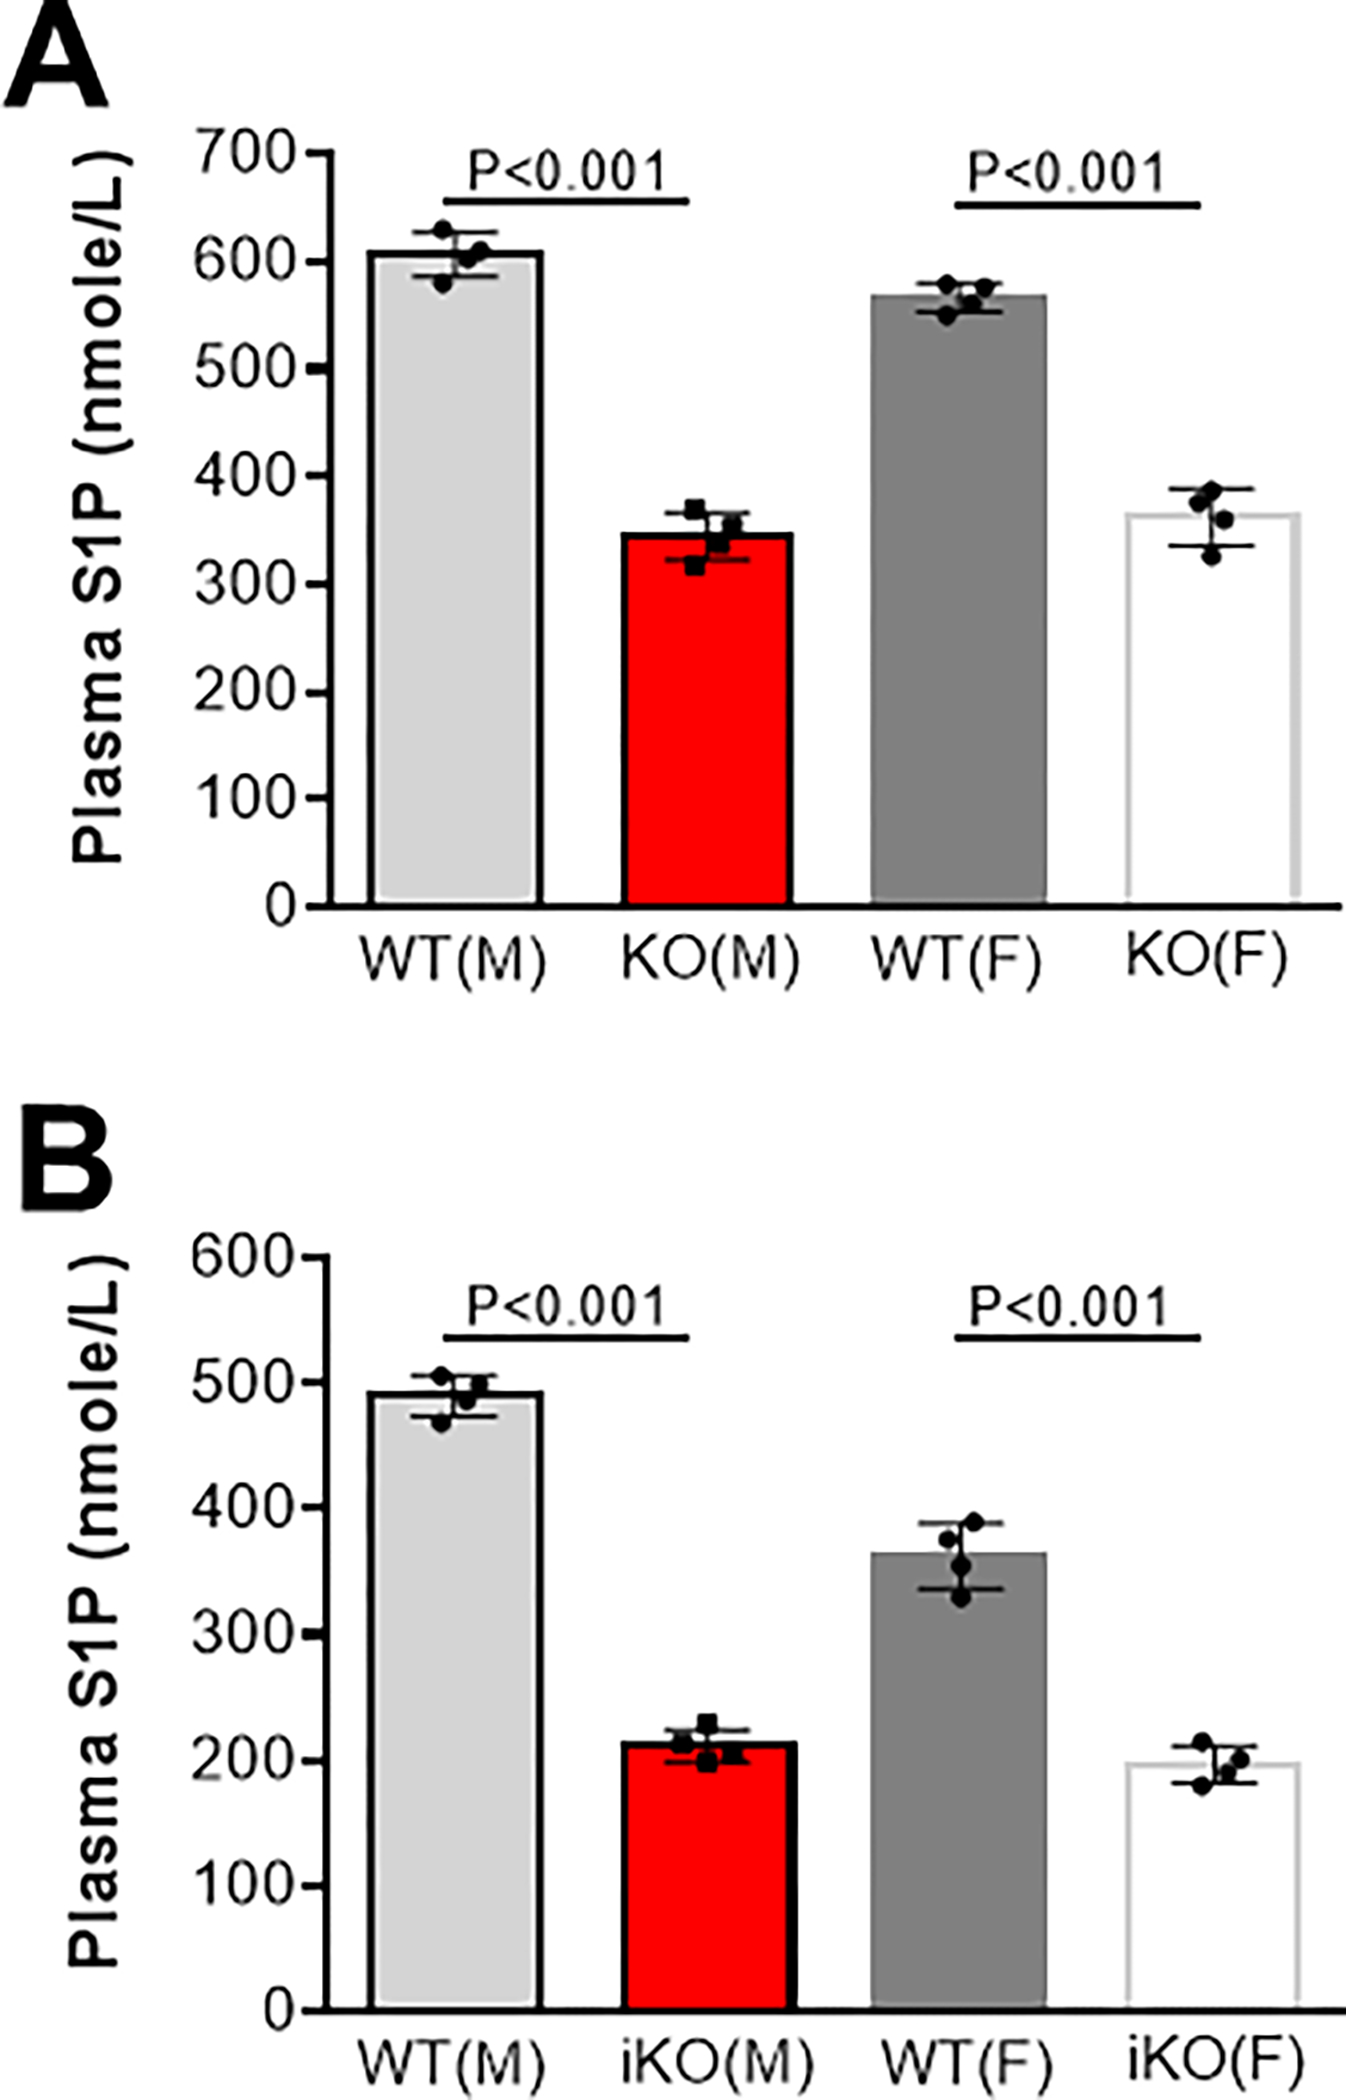
Plasma S1P levels in mice. (A), WT and Pltp KO mice on chow diet. (B), WT and inducible Pltp KO mice on a high fat high cholesterol diet (0.15% cholesterol, 20% saturated fat). M, male; F, female. Values are mean ± SD.

Plasma S1P levels in mice. (A), WT and Pltp KO mice on chow diet. (B), WT and inducible Pltp KO mice on a high fat high cholesterol diet (0.15% cholesterol, 20% saturated fat). M, male; F, female. Values are mean ± SD.