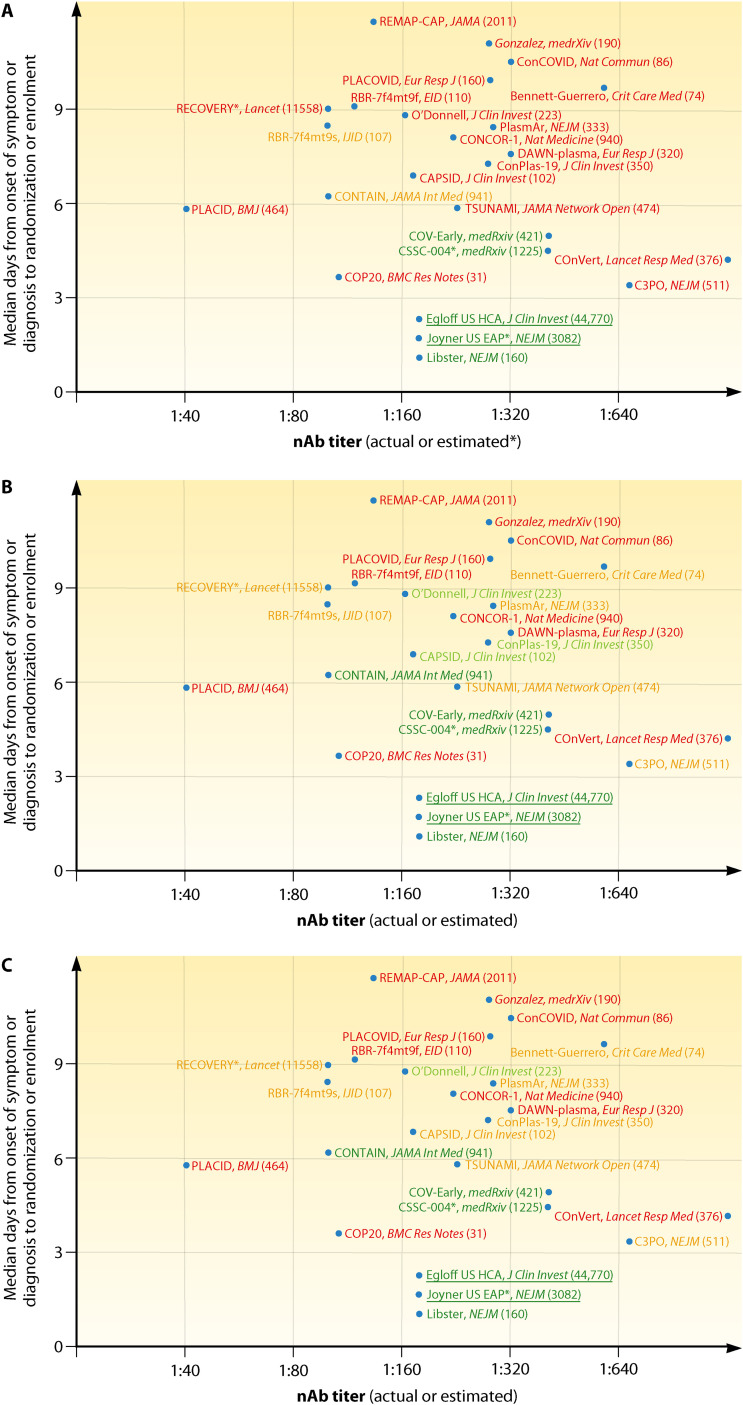
FIG 2.
Simplified graphical representation of CCP RCTs and large uncontrolled trials reported to date, plotted according to earliness of intervention and NAb titers in CCP. (A) Green text indicates trials which met the primary endpoint with statistical significance; orange text indicates trials which failed to meet the primary endpoint but showed statistically nonsignificant trends in favor of CCP; red text indicates trials which failed to show and benefit from CCP in the primary endpoint. (B) Green text indicates trials which showed overall mortality benefit from CCP; orange text indicates trials which showed mortality benefit from CCP in the subgroup of early arrivals or higher NAb titers; red text indicates trials which failed to show any mortality benefit from CCP. (C) Green text indicates trials which showed statistically significant mortality benefit from CCP (overall or in the subgroup of early arrivals or higher NAb titers); orange text indicates trials which showed statistical trends toward mortality benefit from CCP (overall or in the subgroup of early arrivals); red text indicates trials which failed to show any mortality benefit trend from CCP in any subgroup. Underlined text indicates large trials which were not RCT and for which NAb levels were inferred from high-throughput serology but are nevertheless reported as reference studies. Numbers in parentheses indicate the cumulative number of patients enrolled. Sources cited in the figure are references 9–12, 26–30, 34–36, 41, 46, 48, 50, 52, 57, 73, 76, 77, 113, 144, and 145.

