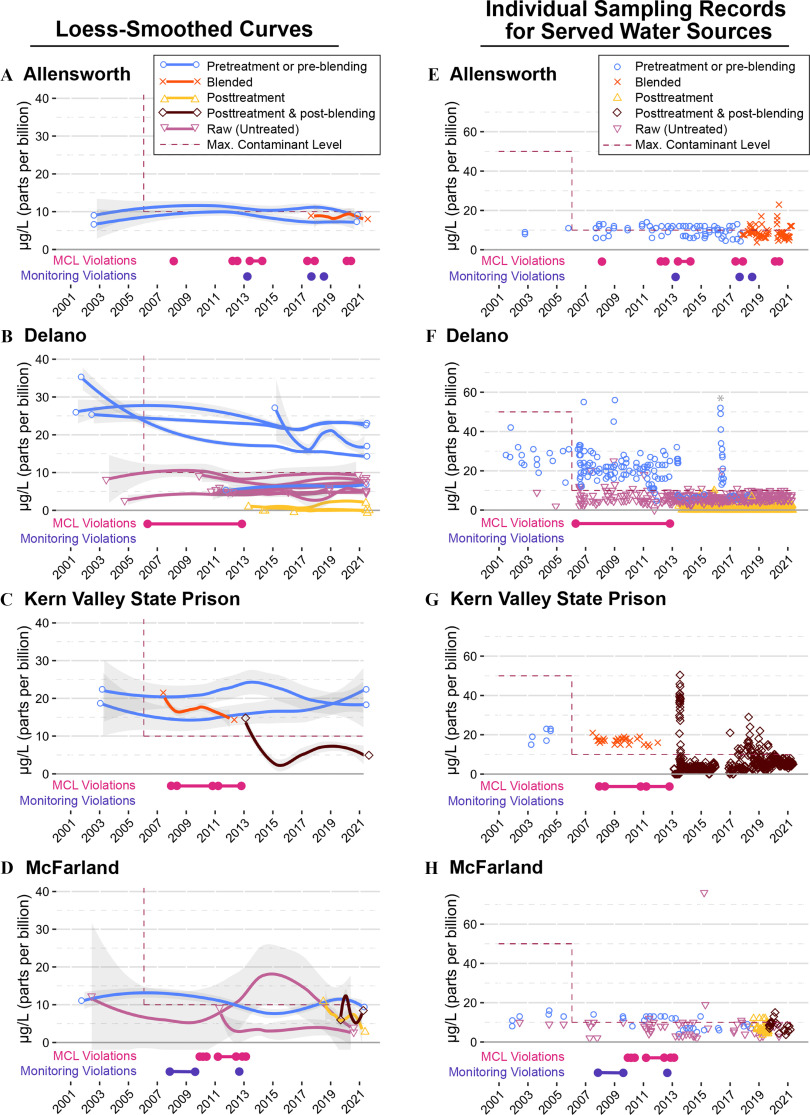
Figure 1.
Public water supply arsenic data for the four study sites (Allensworth, Delano, McFarland, Kern Valley State Prison), January 2001–May 2021. All panels depict reported arsenic concentrations. (A–D) depict loess-smoothed water quality data for each water sampling point within each CWS, with shading for 95% confidence intervals around the moving averages. Pre- and post-arsenic-remediation (i.e., blending or treatment) water quality data are included for comparison and assessment of average arsenic remediation effectiveness. Both MCL violation data and monitoring and reporting violation data for arsenic are shown below each panel for year(s) with violations. For comparison with (A–D), (E–H) depict arsenic concentration sampling data for served water sources only (i.e., water sources served to CWS customers, excluding raw water samples from treated sources). Although running annual averages are used to assess MCL compliance, scatter plot figures reveal served samples that exceeded the MCL, enabling pre- and post-arsenic-treatment comparison. The asterisk in (F) indicates that pretreatment water quality monitoring samples taken around that date were likely sampled during the treatment plant commissioning process and, if so, would not have been served to customers (personal communication from a Water Resource Control Engineer at the California State Water Resources Control Board); however, we include these monitoring results here because engineers at the CSWRCB could not definitively confirm that these samples were not served to customers. In all panels, samples below the detection limit were included as reported in California’s Drinking Water Watch9 and dashed lines indicate the 2006 legal limit (i.e., MCL) change to . Note: CSWRCB, California State Water Resources Control Board; CWS, community water system; loess, locally estimated scatterplot smoothing; max, maximum; MCL, maximum contaminant level.

