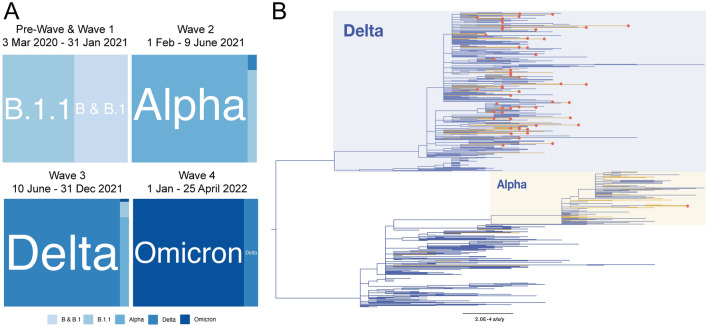
Figure 3.
Phylogenetic analysis of the total SARS-CoV-2 lineages available from Ukraine. (A) Relative distribution of dominant SARS-CoV-2 PANGO lineages in epidemic waves of COVID-19 in Ukraine. “Pre-Wave” and “Wave 1” are combined into one square; (B) Maximum likelihood phylogenetic tree representing SARS-CoV-2 genetic diversity in Ukraine. Yellow branches correspond to sequences sampled in Kyiv. Red circles indicate genomes generated in this study by Nanopore sequencing. The bar at the bottom indicates genetic distance in substitutions per site per year. Branch tip labels are not shown for clarity of tree structure.

