
FIGURE 1.
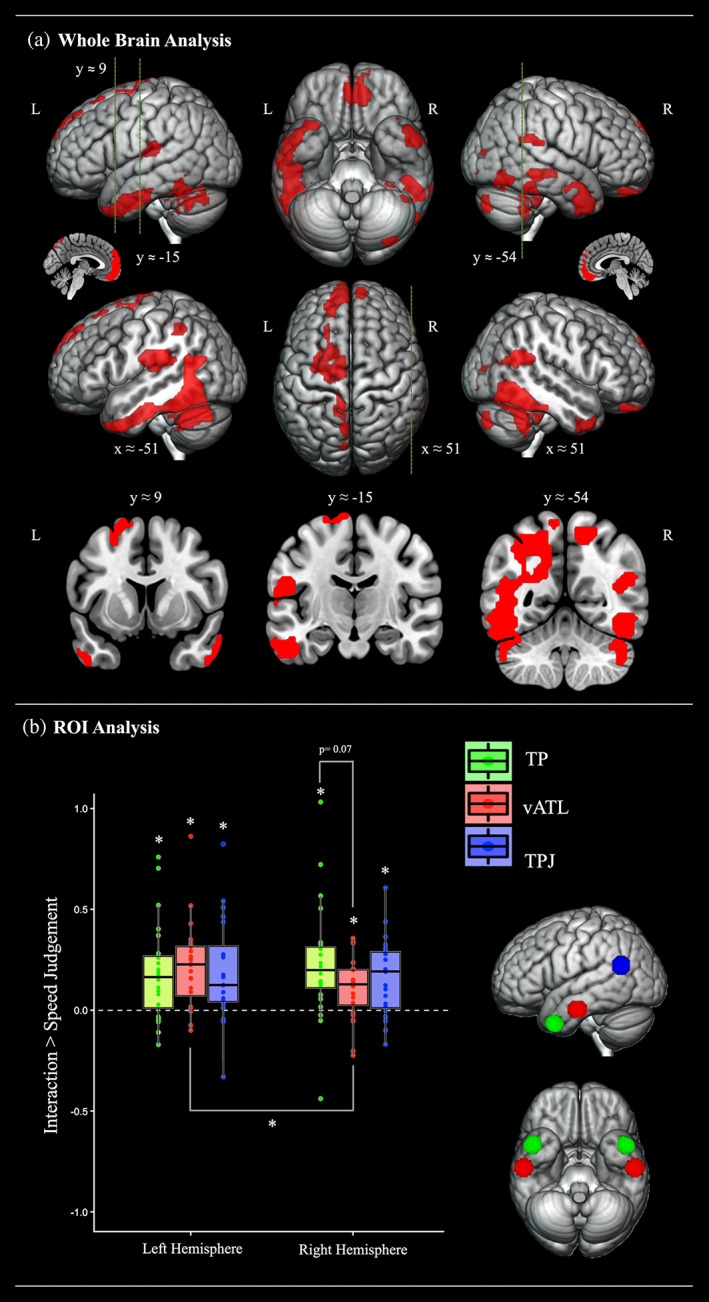
(a) Whole brain analysis. Cortical regions activated during the main experimental ToM task (the interaction judgement), relative to the speed judgement control task. The statistical map was thresholded with an uncorrected voxel height threshold of p < .001 and a family wise error corrected minimum cluster extent threshold (k = 152) at p < .05. Cross sections were chosen to display the location of activation found in key studies investigating ToM processing (Saxe & Kanwisher, 2003; right TPJ [51, −54, 27]), semantic processing of social concepts (Binney, Hoffman, & Lambon Ralph, 2016; left TP [−48, 9, −39]) and general semantic processing (Visser et al., 2012; left inferior ATL [−57, −15, −24]). (b) ROI analysis. summary of the ROI analyses comparing the magnitude of activation for the interaction judgement ToM task (relative to that during speed judgements control task). An asterisk denotes a significant effect at p < .05 after Bonferroni correction. Numerical p values are displayed where comparisons yielded a p value greater than .05 but less than .1. L, left; R, right; TP, temporal pole; TPJ, temporo‐parietal junction; vATL, ventrolateral anterior temporal lobe