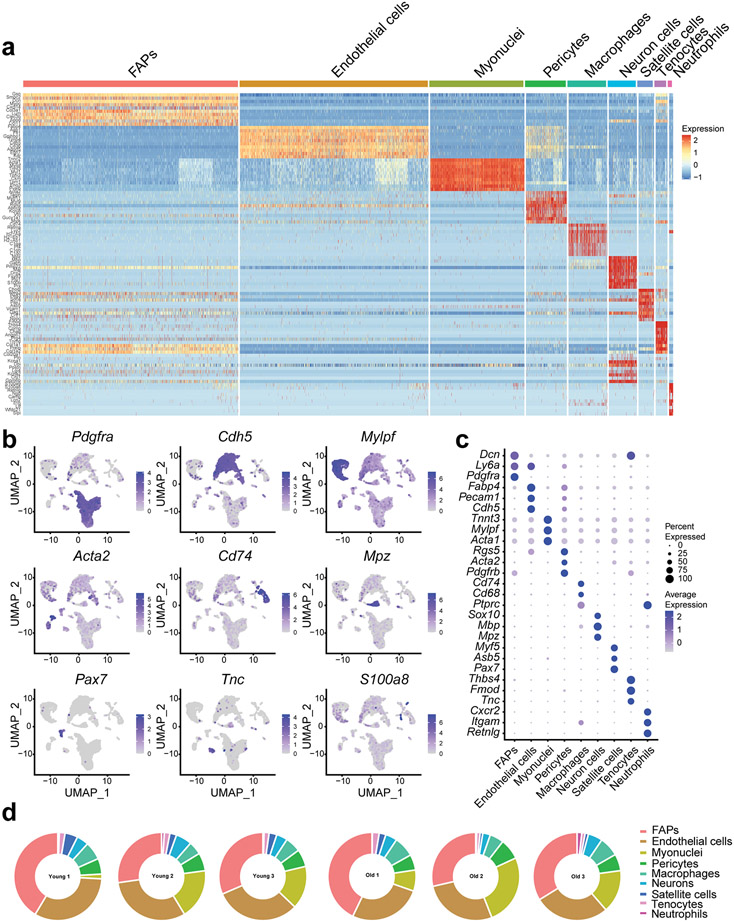
Extended Data Fig. 3.
Identification of skeletal muscle (SkM) cell populations by single cell RNA-sequencing. (a) Heatmap of the genes delineating 10 distinct cell populations in young and old female mice (n = 3 per group). (b) UMAP plot and (c) dot plot showing the main markers of each cell type. (d) Relative abundance of the distinct SkM cell populations in individual mice.

