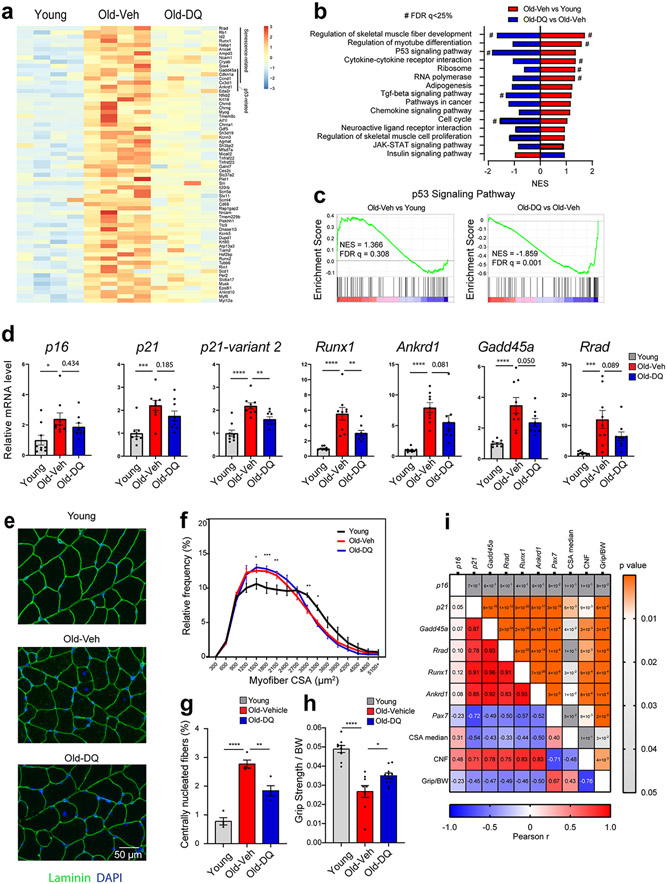
Fig 6.
Senolytics improve the molecular phenotype and function of skeletal muscle (SkM) in female mice. (a) heatmap of the differentially expressed genes between young and old-vehicle mice which exhibited improvements in the old-DQ treated group. (b) GSEA enriched pathways between old-vehicle vs young groups (red) and between old-DQ vs old-vehicle groups (blue). X-axis shows the normalized enrichment score. Negative NES represent downregulation in the group. (c) GSEA plots of P53 signaling pathway between the two group comparisons. (d) qPCR confirmation of the RNAseq data in a larger cohort of mice (n = 9 per group; One way ANOVA test). (e) IF laminin staining on the SkM samples (Representative image of 4 mice per group). (f) CSA distribution in young, old-veh, and old-DQ samples. Asterisks denote the differences between young and old-veh groups (n = 4 per group, two way ANOVA). (g) Centrally nucleated fibers (CNF) in muscles from different groups (n = 4 per group). (h) Grip strength normalized to body weight of mice from different groups (n = 9-10 per group). (i) Pearson correlation analysis between gene expression and SkM morphological measures, and grip strength, with Pearson r value on the left and p value on the right. Error bars represent the standard error of the mean. *, **, and **** denote adjusted p value < 0.05, 0.01, and 0.0001 respectively. # denotes FDR q-value < 0.25 in GSEA analysis.

