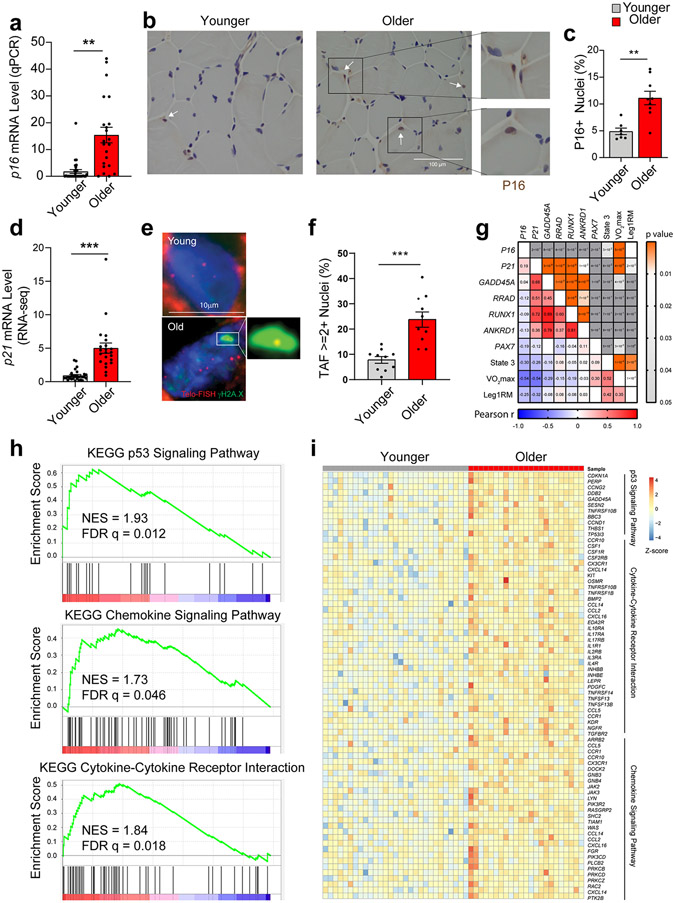
Fig. 7.
Aging and cellular senescence in human skeletal muscle (SkM). (a) Quantification of p16 expression by qPCR in SkM biopsy specimens from younger (n = 30) and older (n = 22) women and men (Two-tailed unpaired t test). (b) Representative images and (c) quantification of P16-positive nuclei by IHC staining (n = 5 per age group). (d) Comparison of p21 expression by qPCR between young (n = 29) and older (n = 22) SkM biopsies specimens. Representative images of TAF staining (e) and quantification of TAF-positive nuclei (f) (n=10 per age group, two-tailed unpaired t test). (g) Pearson correlation analysis between SkM gene expression and functional measurements including maximal oxygen consumption (VO2max, ml/kg/min), leg one-repetition maximum (AU) normalized to fat-free mass (kg) of the leg (Leg1RM), and maximal mitochondrial oxygen consumption (State 3) after the addition of saturating concentrations of adenosine diphosphate (pmol/s/mg tissue), with Pearson r value on the left bottom corner and p value on the right top corner. (h) GSEA plot of the p53 signaling pathway, the chemokine signaling pathway, and cytokine-cytokine receptor interactions that were significantly enriched based on DEGs by RNA-seq between younger and older human SkM. (i) Heatmap of expression of core genes in the enriched pathways. Two-tailed unpaired t test was used; error bars represent the standard error of the mean. ** and *** denote p < 0.01 and 0.001 respectively.

