
Figure 1.
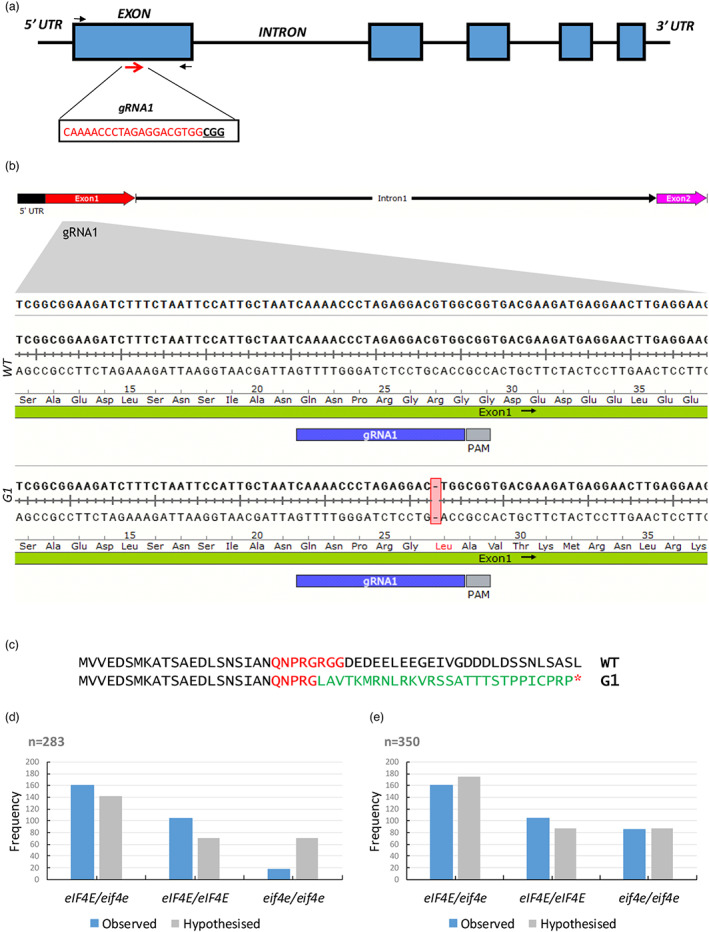
Gene editing of eIF4E mediated by CRISPR/Cas9 in melon plants. (a) Schematic representation of the melon eIF4E genomic map and the gRNA1 target site (red arrows). The target sequence is shown in red letters, and the protospacer adjacent motif (PAM) is marked in bold underlined letters. The black arrows indicate the primers flanking the target sites used to detect the mutations. (b) eIF4E genomic DNA alignment between WT and mutated T0 lines of fragments corresponding to a DNA fragment containing the gRNA1 sequence representative of the two independent lines obtained. A DNA deletion is highlighted in a red box. (c) eIF4E protein sequence alignments between WT and mutated T0 lines. The protein sequence downstream of the deletion site is shown in green; the target region in red and the red asterisk represents a premature stop codon. (d) Segregation and relative frequencies of the 283 F2 plants (excluding non‐germinated seeds) (N = 283, Ratio 1:2:1, degrees of freedom = 2, X2 = 57.6, P < 0.05) and (e) hypothesized segregation and relative frequencies of 350 F2 plants assigning non‐germinated seeds to the homozygous recessive group (N = 350, Ratio 1:2:1, degrees of freedom = 2, X2 = 4.3, P > 0.05). [Colour figure can be viewed at wileyonlinelibrary.com]