
Figure 2.
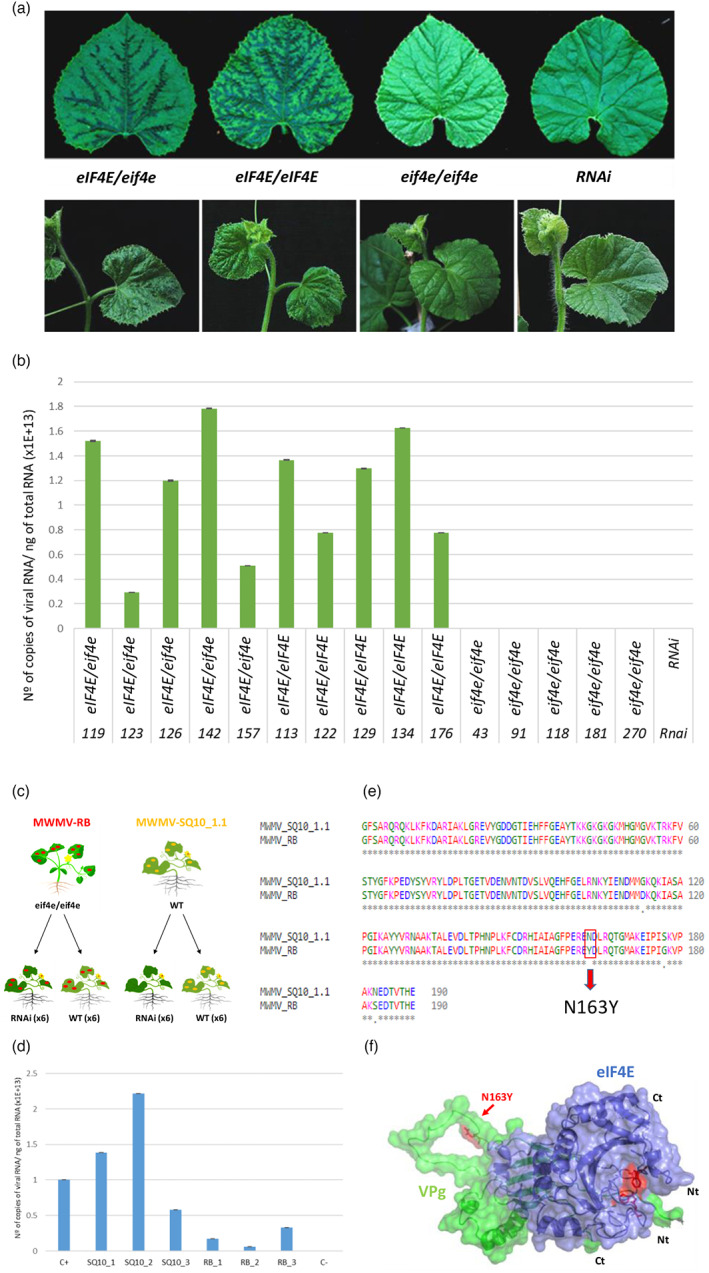
Homozygous eif4e mutant plants exhibited immunity to Moroccan watermelon mosaic virus (MWMV) infection. (a) Disease symptoms (leaves ‐upper panel‐ and plants ‐lower panel‐) of heterozygous (eIF4E/eif4e), homozygous wild type (WT) (eIF4E/eIF4E), and recessive homozygous (eif4e/eif4e) of the F2 edited generation and RNAi (control) plants (Rodríguez‐Hernández et al., 2012) at 14 days post inoculation (dpi). (b) Reverse transcription‐quantitative polymerase chain reaction (RT‐qPCR) analysis of MWMV RNA accumulation at 21 dpi in five individuals heterozygous (eIF4E/eif4e), homozygous WT (eIF4E/eIF4E), recessive homozygous (eif4e/eif4e) and RNAi (control) (Rodríguez‐Hernández et al., 2012) plants. Error bars represent standard deviation. (c) Back‐inoculation assay: samples from an eif4e/eif4e resistant plant that presented late MWMV symptoms were used as a source of inoculum (red spots). MWMV‐SQ10_1.1 are WT plants infected with the original source of inoculum used to test the F2 mutants for resistance (yellow spots). (d) Reverse transcription‐quantitative polymerase chain reaction (RT‐qPCR) analysis of MWMV RNA accumulation at 14 dpi in individual plants. SQ10_1, SQ10_2 and SQ10_3 correspond to WT plants inoculated with MWMV‐V. RB_1, RB_2 and RB_3 are RNAi lines infected with MWMV‐RB. C+ is a F2 susceptible plant infected with MWMV. C‐ is a mock inoculated plant. Error bars represent standard deviation. (e) Multiple alignment of amino acid sequences of VPg from MWMV‐RB and MWMV‐SQ10_1.1. The unique amino acid change between the two variants is underlined in red. (f) Simulated 3D surface model of the interaction between MWMV VPg (green) and eIF4E (blue) complex. Tryptophans W82 and W182 from eIF4E involved in the association with m7GTP Guanosine‐5′‐triphosphate cap analogue are shown in sticks and coloured red. The N163Y substitution responsible for the overcoming of the resistance to MWMV is indicated by a red arrow. [Colour figure can be viewed at wileyonlinelibrary.com]