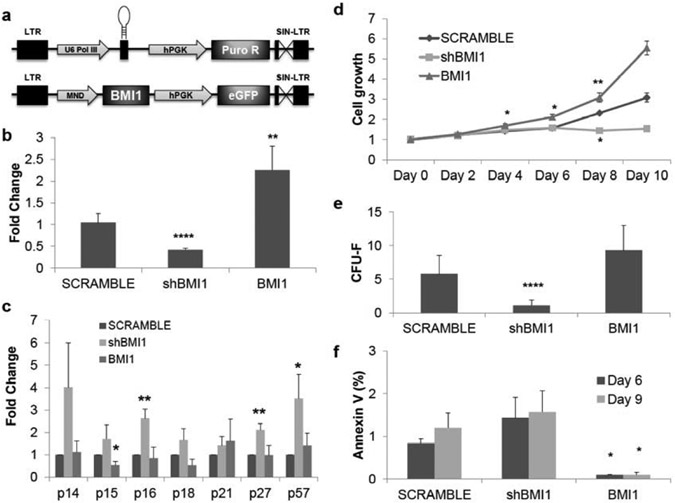
Fig. (1). BMI1 expression regulates cell proliferation and apoptosis in human adult bone-marrow mesenchymal stem cells.
(a) Schematic diagram of shRNA targeting BMI1 expressing and BMI1 expressing lentiviral vectors (b) mRNA expression of BMI1 isolated from MSCs 72 hours after the transduction of specific shRNAs targeting BMI1 lentivirus (shBMI1, P=2.3x10⁻⁵) or BMI1 overexpressing vectors (BMI1, P=0.0031). Expression was normalized to GAPDH and shown as fold change relative to SCRAMBLE samples set to 1. pLKO.1-scramble was used as vector control. n=4. (c) Derepression and hyper-repression of cyclin-dependent kinase inhibitors by shBMI1 and overexpression of BMI1, respectively. Samples were collected 72 hours after transduction and applied to quantitative real-time polymerase chain reaction (qRT-PCR), normalized as in (b). p16 (P=0.007), p27 (P=0.006), and p57 (P=0.05) was upregulated upon shBMI1. p15 (P=0.025) was downregulated by BMI1 overexpression. n=4. (d) MTT cell growth assay shows cell proliferation differences between shBMI1 and overexpression of BMI1. Cell growth is shown as fold change relative to day 0 of SCRAMBLE samples set to 1. For the BMI1 overexpression, at day 4 (P=0.039) outgrowth was observed, day 6 (P=0.033), day 8 (P=0.009). For shBMI1, at day 8 (P=0.002) cell proliferation was reduced. n=3. (e) Colony-forming unit-fibroblast assay (minimum 50 cells per colony) in knockdown of BMI1 showed reduced colony forming capacity (P=0.004) but overexpression of BMI1 increase the number of colonies. n=3. (f) MSCs require BMI1 to avoid apoptosis. Annexin V+ cells increase over in vitro cultures at shBMI1 MSCs but overexpression of BMI1 significantly reduces apoptosis. Date is matched to (e). n=3. BMI1 at day 6 (P=0.029) and day 9 (P=0.036). *: P<0.05, **: P<0.01, ***: P<0.001, ****: P<0.0005. Data shown as mean ± SEM.

