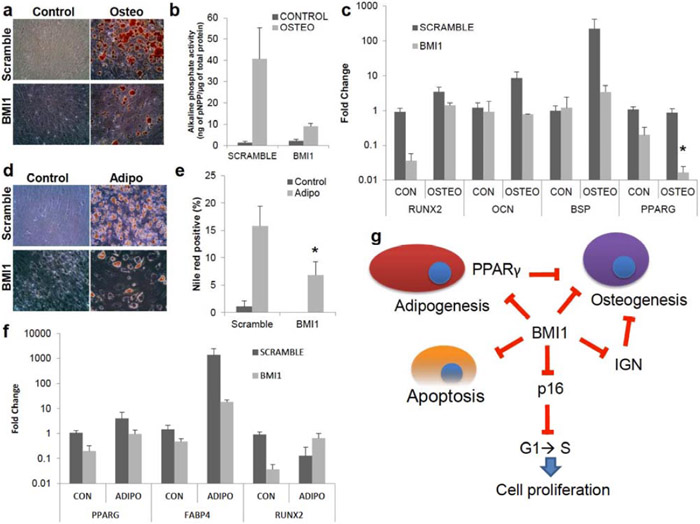
Fig. (4). Hyper-repression of developmental regulator network via overexpression of BMI1 decreases osteogenic and adipogenic differentiation.
(a-c) Osteogenesis in BMI1 overexpressing MSCs was tested. Control; no osteogenic induction, Osteo; osteogenic induction. (a) Images from Alizarin Red S staining for osteogenesis. (b) Alkaline phosphate activity, normalized as in Fig. (3b), in BMI1 overexpressing MSCs was reduced (P=0.27), n=3. (c) Gene expression of RUNX2 (P=0.09) in osteogenesis, normalized as in Fig. (1c), was repressed upon overexpressed BMI1 samples without osteogenic induction. mRNA expression of PPARγ (P=0.017) was reduced by BMI1 overexpression with an osteogenic induction. (d-f) Adipogenesis in BMI1 overexpressing samples was evaluated 14 days after adipogenic induction (d) Images from Oil Red O staining for adipogenesis. (e) Nile Red+ cells by flow cytometry showed slight reductions in BMI1 overexpressing samples (P=0.011). n=4. (f) mRNA expression of PPARγ and FABP4, normalized as in Fig. (1b), shows that derepression of these transcripts were observed without adipogenic inductions. Gene expression of RUNX2 was shown. n=3. (g) A schematic depicting the model for self-renewal by BMI1. BMI1 represses cyclin-dependent kinase inhibitors to promote G1 to S phase cell cycle entry, which leads to cell proliferation. In addition, BMI1 regulates programmed cell death. For the regulation of differentiation into bone or fat, BMI1 represses RUNX2 and PPARγ transcripts, respectively. IGN, which was shown to prevent osteogenesis, was regulated by BMI1. *: P<0.05, **: P<0.01, ***: P<0.001, ****: P<0.0005 Data shown as mean ± SEM.

