. 2022 Aug 23;39(9):1876–1896. doi: 10.1039/d2np00032f

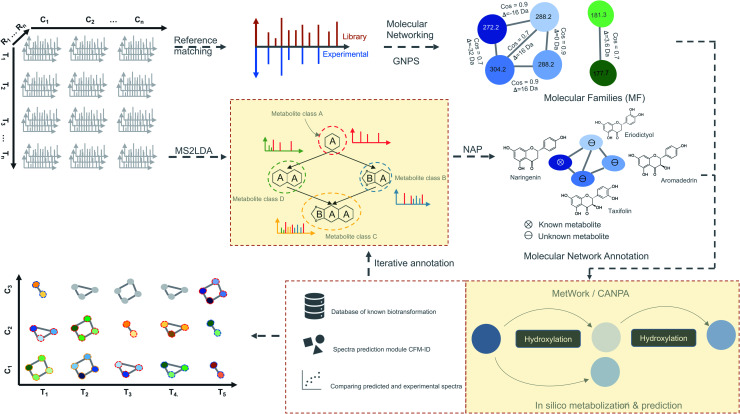
Fig. 4. Time-based metabolomics data analysis. Molecular networks are generated using spectral data from all the MS2 samples by classical or feature-based molecular networking implemented in the GNPS.86 Additionally, spectral data are also subjected to the substructure discovery using MS2LDA79 and NAP.91 Metabolite annotation is further extended by in silico-metabolization method implemented in the MetWork101 pipeline. In addition, MetWork also proposes CFM-ID-predicted MS/MS spectra of the derivatized substrates. The time-series design is then applied to all the samples to check the distribution of differentially abundant metabolite (DAMs) across timepoints and across different conditions to better predict biosynthetic pathways.

Fig. 4