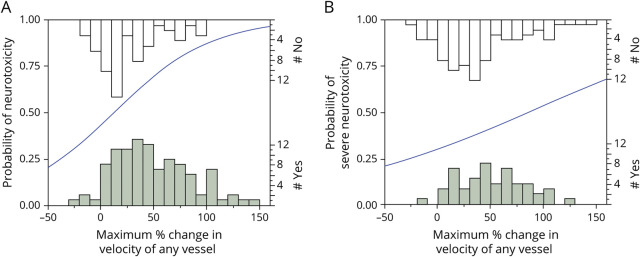
Figure 1. Association of Change in MFV and Neurotoxicity.
Regression analysis between the maximum percent change in MFV in any vessel at any point during hospitalization and the occurrence of (A) any grade neurotoxicity or (B) severe neurotoxicity (CTCAE grade ≥3). The left-sided Y-axes indicate the probability of (A) neurotoxicity or (B) severe neurotoxicity predicted by the univariate logistic regression model. The histograms along the bottom and top X axes indicate the number of patients with (shaded bars) or without (open bars) neurotoxicity or severe neurotoxicity at each MFV range; counts are indicated on the right-sided Y-axes. The blue line represents the best fit of the logistic regression analysis examining the probability that neurotoxicity (A) or severe neurotoxicity (B) will occur as a function of the maximum percent change in velocity of any vessel. A 10% increase in MFV had an OR of 1.24 (95% CI: 1.11–1.39, p = 0.0002, Wald χ2 test) for developing neurotoxicity and an OR of 1.104 (95% CI: 1.004–1.215, p = 0.0421, Wald χ2 test) for developing severe neurotoxicity. CTCAE = Common Terminology Criteria for Adverse Events; MFV = mean flow velocity.

