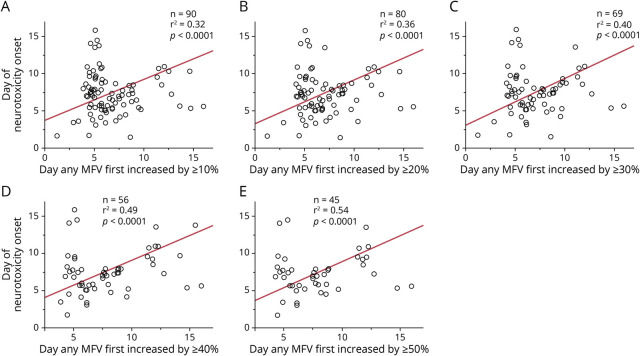
Figure 2. Correlation of Day of Change in MFV and Day of Neurotoxicity Onset.
Correlation between the day that TCDs first exceeded a threshold percent change in maximum MFV above baseline and day of onset of neurotoxicity, for 5 different thresholds. (A) Correlation between day of neurotoxicity onset and day that MFV first exceeded 10% elevation, n = 90, r2 = 0.32, p < 0.0001, t-test. (B) Correlation between day of neurotoxicity onset and day that MFV first exceeded 20% elevation, n = 80, r2 = 0.36, p < 0.0001, t test. (C) Correlation between day of neurotoxicity onset and day that MFV first exceeded 30% elevation, n = 69, r2 = 0.40, p < 0.0001, t test. (D) Correlation between day of neurotoxicity onset and day that MFV first exceeded 40% elevation, n = 56, r2 = 0.49, p < 0.0001, t test. (E) Correlation between day of neurotoxicity onset and day that MFV first exceeded 50% elevation, n = 45, r2 = 0.54, p < 0.0001, t test. MFV = mean flow velocity; TCD = transcranial Doppler.

