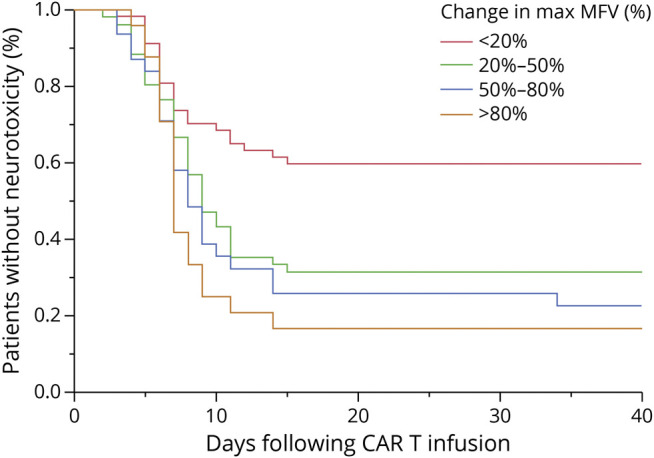
Figure 3. Relationship of Maximum Change in MFV and Timing of Neurotoxicity.

Kaplan-Meier curves demonstrating the relationship between the maximum percent rise in MFV and the timing of onset of and proportion of patients who develop neurotoxicity after CAR T infusion. Red curve shows patients with maximum percent rise in MFV above baseline of <20% (n = 57), green curve shows patients with maximum percent rise in MFV above baseline of 20%–50% (n = 52), blue curve shows patients with maximum percent rise in MFV above baseline of 50%–80% (n = 31), and orange curve shows patients with maximum percent rise in MFV above baseline of >80% (n = 25). There is a significant relationship between maximum MFV group and percentage of patients who develop neurotoxicity (p = 0.0004, log-rank test). CAR = chimeric antigen receptor; MFV = mean flow velocity.
