
Figure 4. Intracranial Artery With Maximum MFV.
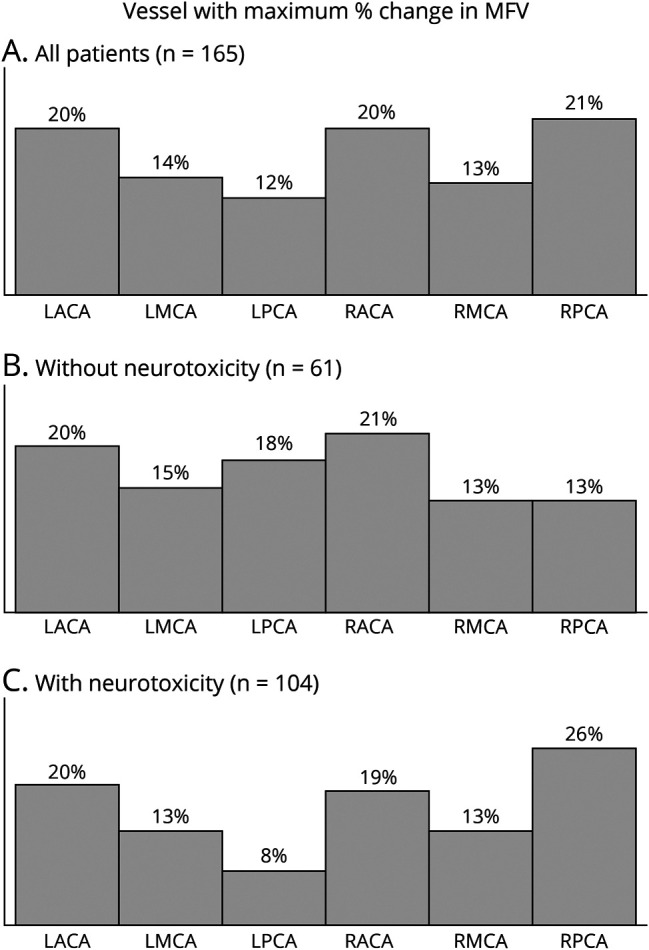
The artery demonstrating the maximum elevation in MFV identified in all patients (A), only patients without neurotoxicity (B), and only patients with neurotoxicity (C). After correcting for multiple comparisons, the frequency of which vessel demonstrated the maximum change in MFV was not significantly different from chance for any of the 3 groups (all patients: n = 165, p = 0.1212; neurotoxicity absent: n = 61, p = 0.8142; neurotoxicity present: n = 104, p = 0.0245; Pearson χ2 test). MFV = mean flow velocity.