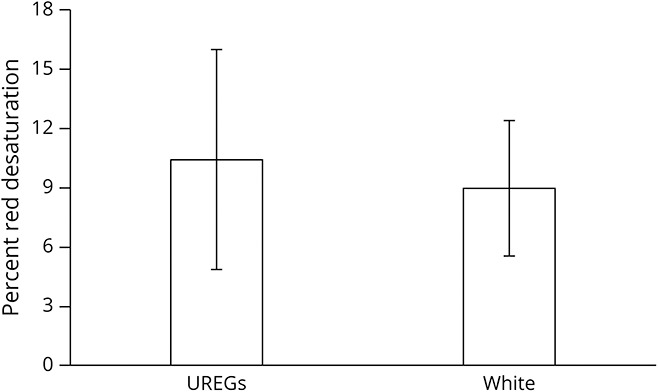
Figure 3. Percent Red Desaturation as a Function of Race.

Although underrepresented racial and ethnic group (UREG) status was associated with a higher average percent red desaturation, this difference was not statistically significant (p = 0.69). Error bars shown are 95% confidence intervals.
