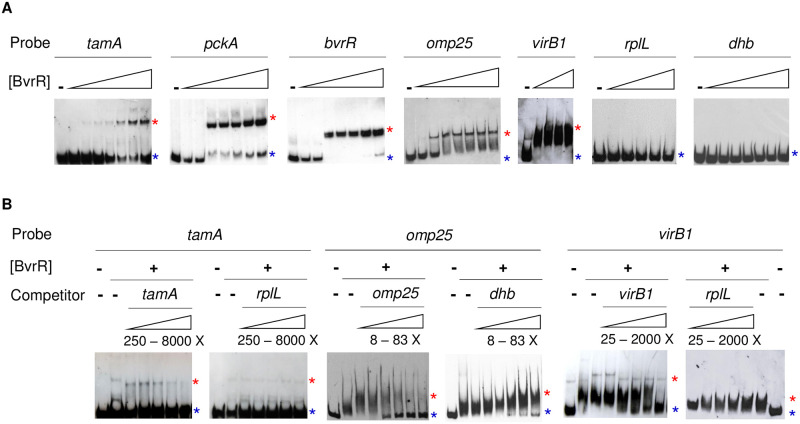
Fig 4. Biochemical confirmation of the direct binding of BvrR-P to the upstream intergenic region of selected target genes.
A. Direct EMSA with the following probes: tamA, pckA, bvrR, omp25, virB1, and negative controls rplL and dhbR. The probes were designed based on the location of the significant ChIP-Seq signals obtained in this study and previous information about transcriptional units and promoter structures when available [24, 42, 78]. Protein concentrations for each experiment varied from 0.05 to 2.6 μM. B. Competitive EMSA using increasing concentrations of free probe (competitor). The protein concentration was 0.6 μM. Red asterisks represent the migration pattern of a protein-DNA complex (shift). Blue asterisks represent the migration pattern of a free probe (no shift). Experiments in panels A and B are independent of each other. All gels have either negative (probe without protein) or positive controls (probe with protein) to compare. These results are representative of at least three independent experiments.

