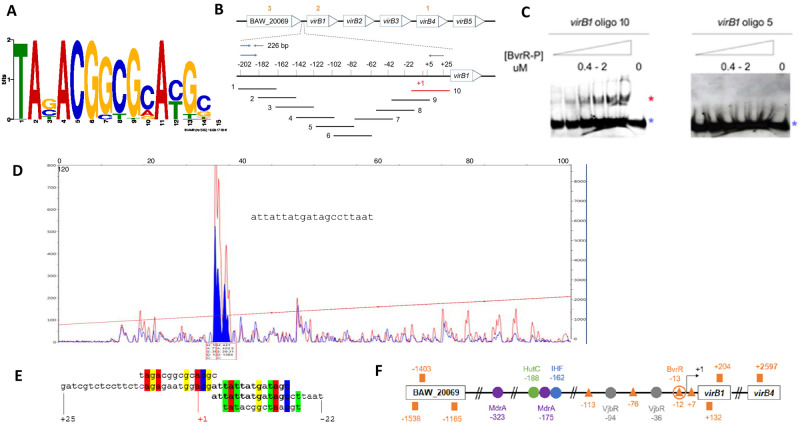
Fig 5. Location of the DNA binding motif recognized by BvrR-P in the promoter region of virB1.
A. DNA binding motif recognized by BvrR-P under conditions that mimic the intracellular environment obtained using GLAM2 for motif discovery within the significant ChIP-Seq signals dataset. B. Schematic non-scale representation of the virB operon and upstream gene BAW_20069. Orange numbers represent each of the three significant ChIP-Seq signals in this region. The zoomed area represents a 226bp virB1 upstream region, with a promoter region previously reported [42]. Red and black lines represent oligonucleotides that did and did not interact with BvrR-P by EMSA. C. EMSA results for the virB1-oligonucleotides number 10 and 5. Red and blue asterisks represent the migration patterns of a protein-DNA complex (shift) and a free probe (no shift). D. Dnase I footprinting results using BvrR-P and the 226 bp DNA fragment encoding the virB1 promoter region. The traces are the Dnase I digested DNA fragments incubated with bovine serum albumin as control (red) or with BvrR (blue). Blue-filled peaks represent the Dnase I-protected region inferred according to [43]. The panel includes the DNA sequence obtained after Sanger sequencing. E. Sequence alignment between two configurations of the DNA binding motif (first and last line) derived from the motif shown in Fig 5A, the virB1-oligonucleotide 10 (second line), and the Dnase I-protected region (third line). F. BvrR-P binding sites in the virB regulatory region. The orange squares represent the location of ChIP-Seq signals obtained in this study. The orange triangles represent the location of regions with percentages of sequence similarity to the DNA binding motif shown in A, ranging from 50 to 71.43%. The orange circle represents the BvrR-P binding site confirmed by EMSA and DnaseI footprinting. The colored circles (purple, green, blue, and gray) represent the binding sites for other transcription factors described to regulate the expression of the virB operon [80]. Number coordinates are relative to the transcription start site (black arrow). These results are representative of at least three independent experiments.

