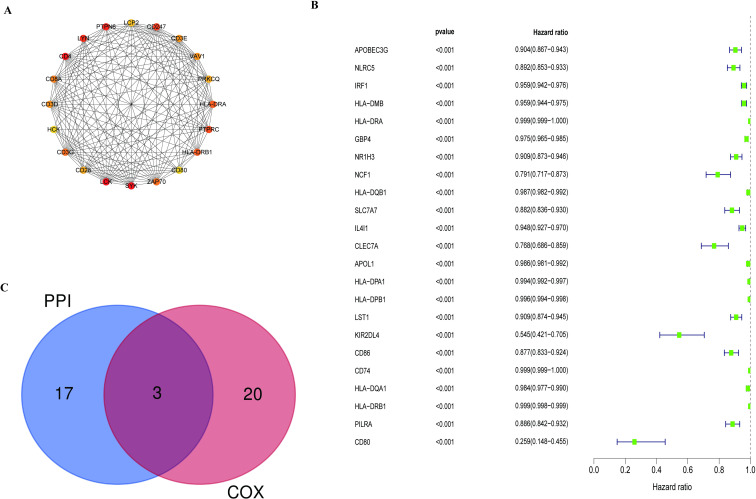
Fig 5. Protein–protein interaction network analysis and univariate Cox regression analysis.
(A) The network of top 20 hub genes with high connectivity degree in the PPI network. (B) The Forest map represented the result of the univariate Cox regression analysis. (C) Venn plot showed the intersection part of the result of the PPI network and univariate Cox regression analysis.

