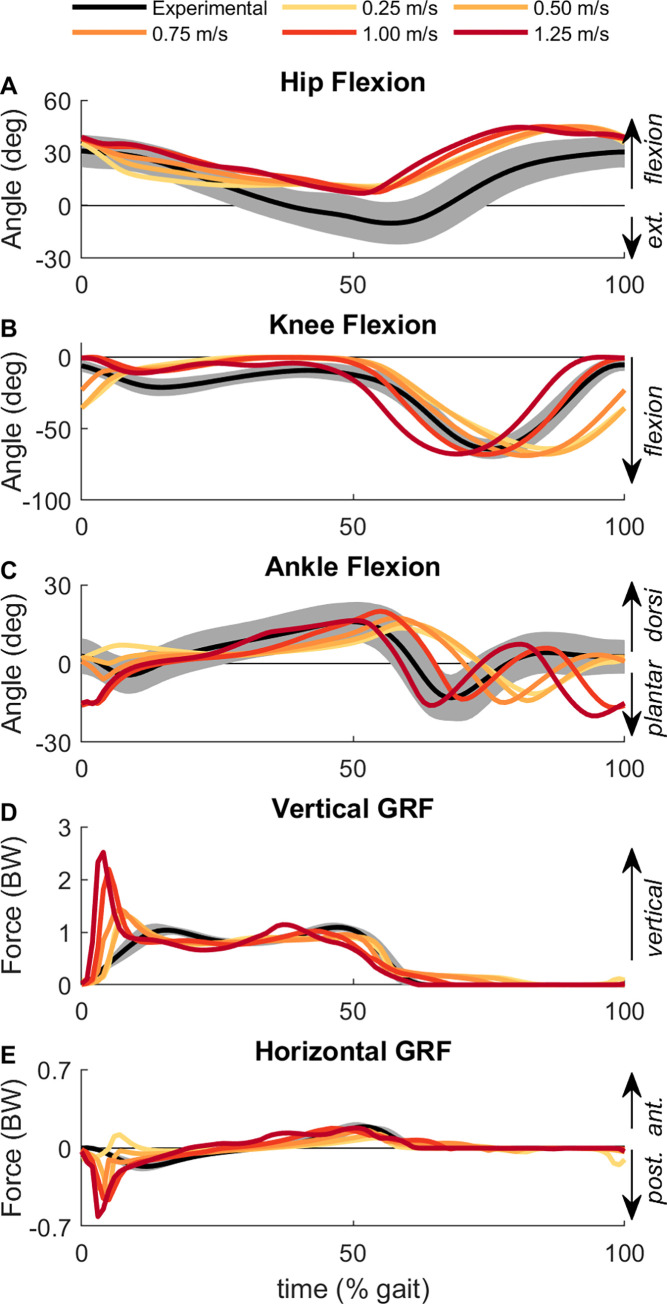
Fig 2. Baseline kinematic and ground reaction forces.
The (A) hip flexion, (B) knee flexion, (C) ankle flexion angles and (D) vertical GRF and (E) horizontal GRF for the base model across each of the five gait speeds. Experimental kinematics and GRFs from adults walking at 1.1 m/s is shown as the mean (black line) and 2 standard deviations (shaded region) [85]. Time is normalized to the gait cycle with 0% being the time of right heel strike.

