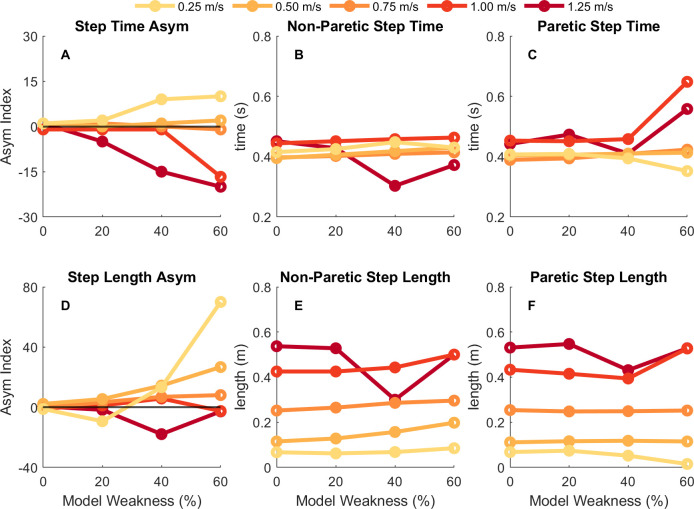
Fig 4. Step time and step length results.
Spatiotemporal results for step time (top row) and step length (bottom row) for each condition and each speed. The leftmost column is the step time or step length asymmetry index (A, D), middle column is the non-paretic (right) step time or step length value (B, E), and rightmost column is the paretic (left) step time or step length value (C, F). Darker, red colors depict results for faster speeds while lighter, yellow colors depict results for slower speeds. Positive asymmetry indices indicate that the non-paretic value is greater than the paretic value, whereas negative asymmetry indices indicate that the paretic value is greater than the non-paretic value.

