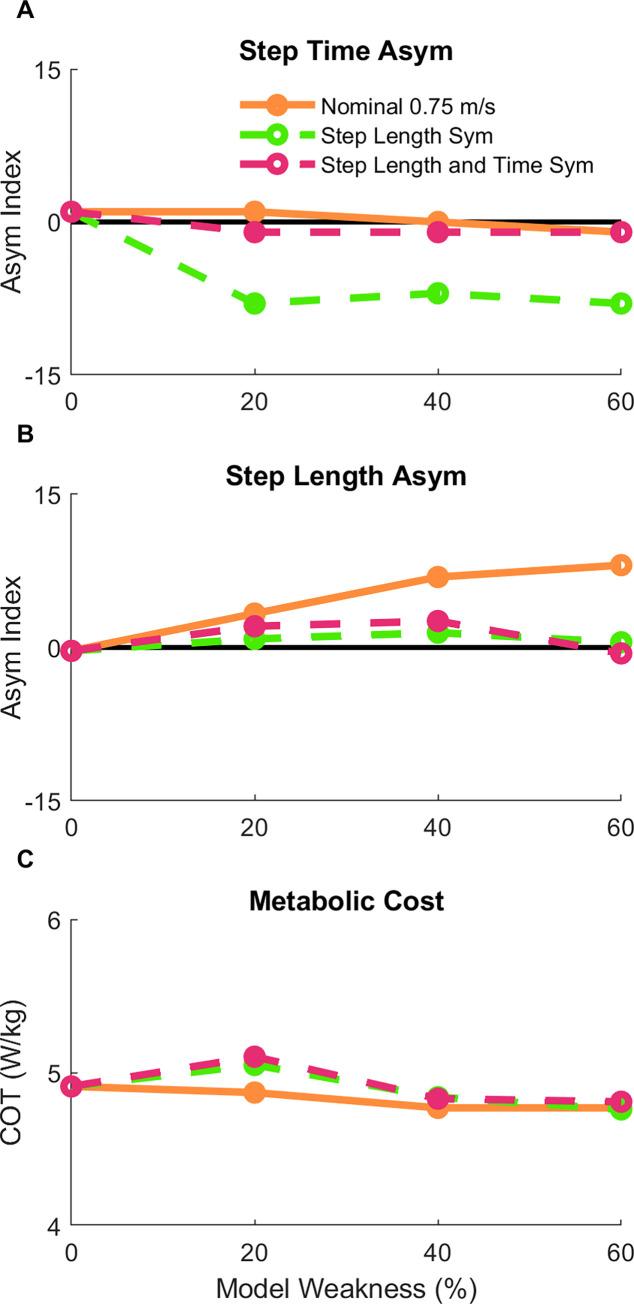
Fig 7. Secondary analysis of spatiotemporal asymmetry.
After the nominal conditions (orange solid line), additional optimizations were performed across the three hemiparetic models with the goal of reducing the step length asymmetry (green dashed line) to assess the effect of enforced step length (B) symmetry on step time asymmetry (A) and metabolic cost (C). Finally, a set of optimizations were performed with the goal of reducing both step length and step time asymmetry (purple dashed line).

