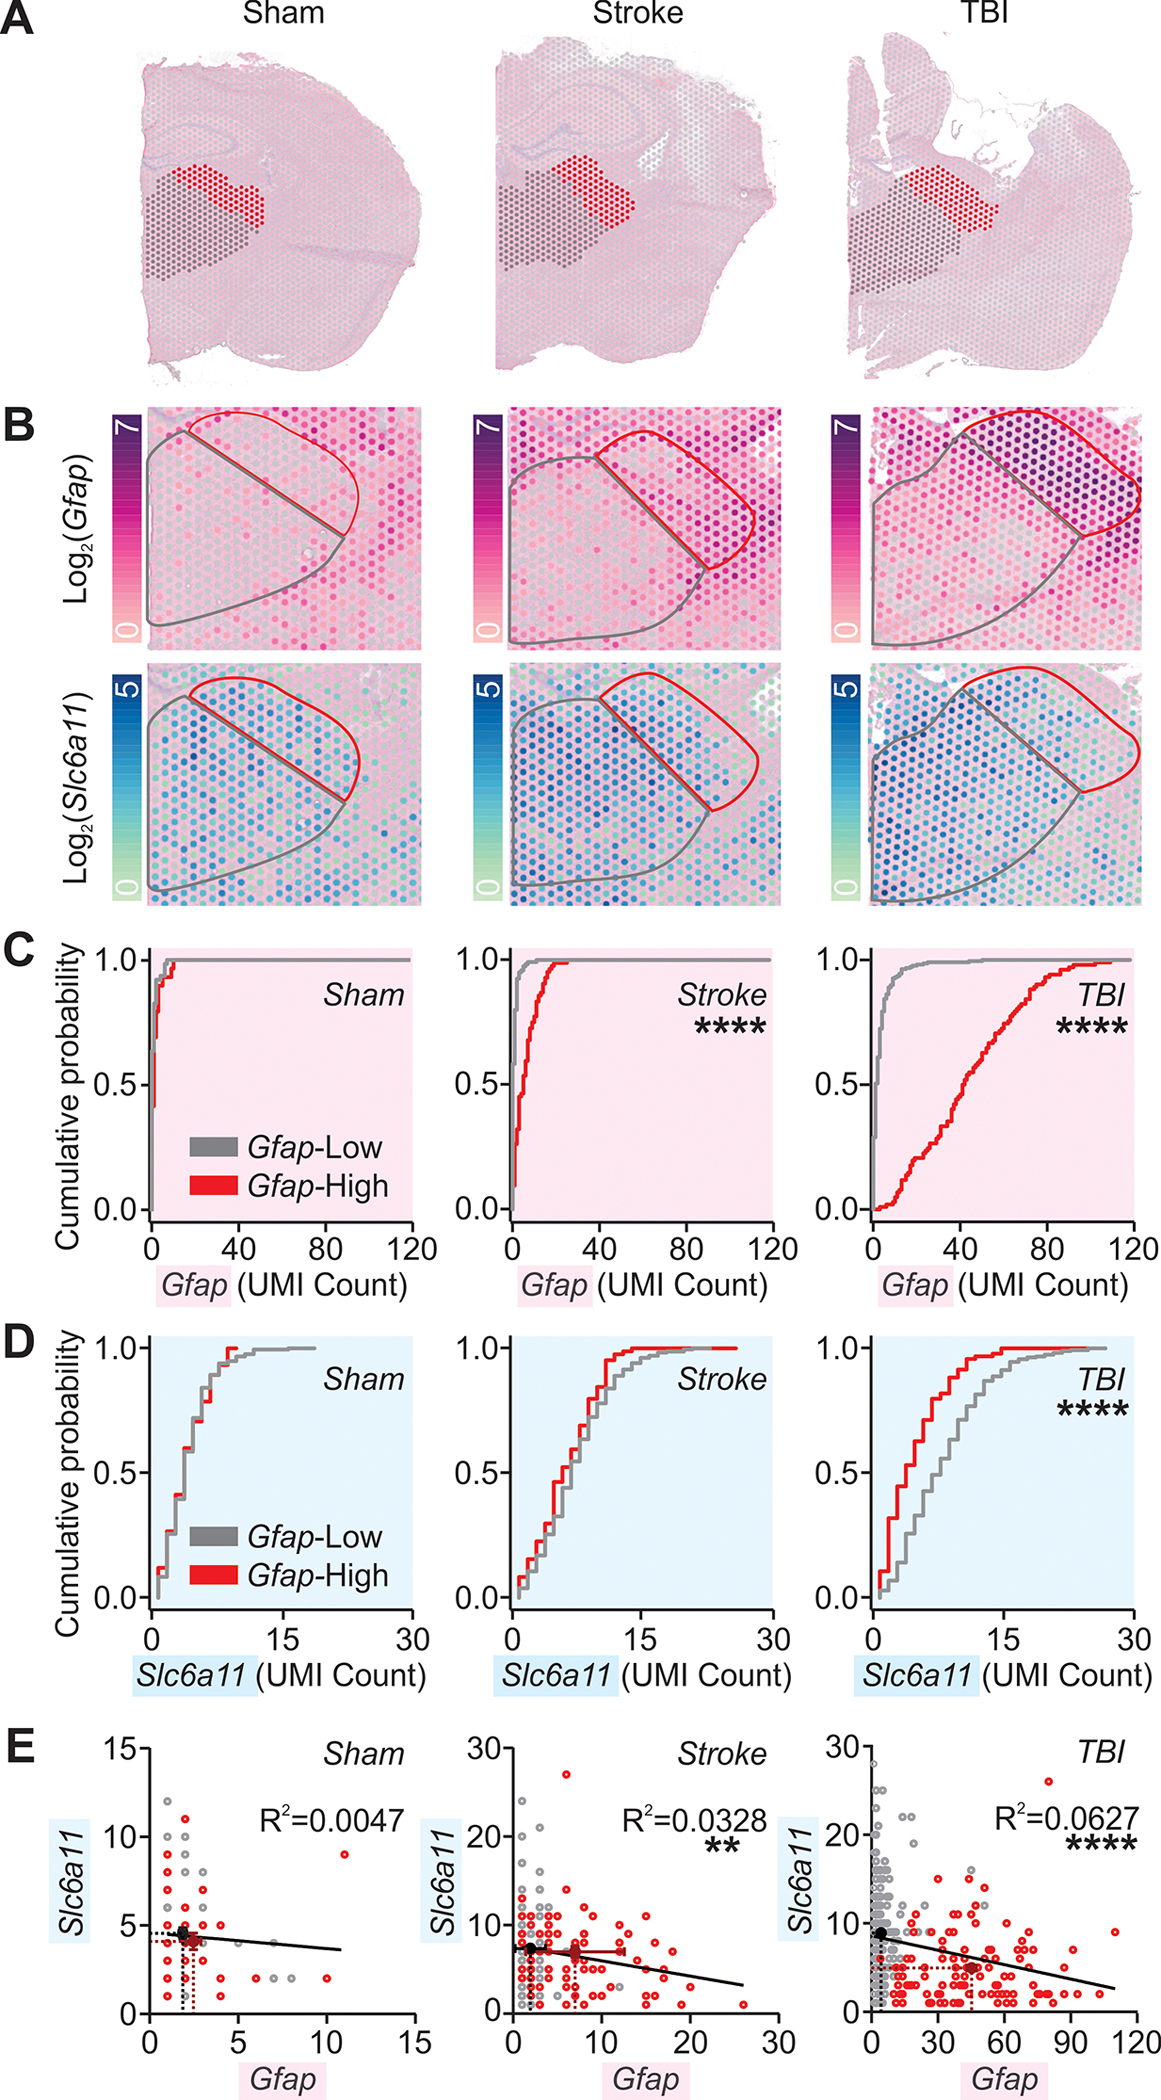
Fig. 7. Cortical injury-induced thalamic Gfap is negatively correlated with thalamic Slc6a11 expression.

(A) Hemi-brain sections from mice after sham, stroke, and TBI procedures six weeks after surgery overlaid with thalamic regions of interest (grey and red) analyzed with 10x Visium spatial transcriptomics and magnified in (B). (B) Thalamic expression of Gfap and Slc6a11 transcripts. Color map indicates log2 of the detected counts of the gene’s unique molecular identifier (UMI). Red and black outlines correspond to regions of interest shown in (A) and to regions with high and low Gfap expression in cortical injury, as detailed in (C). (C, D) Cumulative probability distribution of Gfap (C) or Slc6a11 (D) expression per spot in regions indicated in (A-B). Kolmogorov-Smirnov test, ****P<0.0001. All spots containing non-zero UMI counts were included. Number of spots from low- and high-Gfap regions, respectively, in (C): sham (n=63 & 29); stroke (n=120 & 84); TBI (n=218 & 102); in (D): sham (n=216 & 76); stroke (n=237 & 85); TBI (n=277 & 95). Adjusted α=0.025 for multiple comparisons. (E) Relationship between Gfap and Slc6a11 expression. Circles represent UMI counts per spot in low- (grey) and high-Gfap (red) areas; black and burgundy crosses, and corresponding dotted lines, mark mean±SEM for low- and high-Gfap areas respectively. Black lines plot the best-fit slopes and intercepts from a simple linear regression. **P=0.0095, ****P<0.0001. Number of spots: sham (n=93); stroke (n=204); TBI (n=322). Similar analysis for cortical regions distal and proximal to injury is described in fig. S9.
