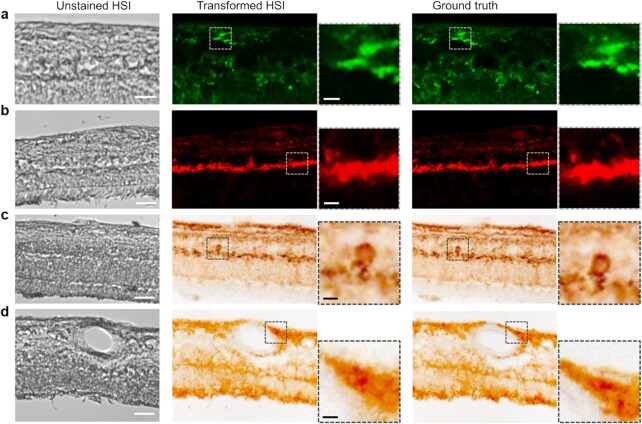
Figure 4.
Stitched ROIs of the trained GAN models output. (a) Aβ42 fluorescence model. (b) pS396-Tau fluorescence model. (c) pS396-Tau DAB model, with a focus on a retinal NFT structure. (d) Aβ42 DAB model. From left to right: HSI intensity image, transformed HSI images, zoomed prediction images of specific feature, ground truth images, and zoomed ground truth images of specific feature. Scale bar, 50 µm for large FOV images, 10 µm for bordered inserts.

