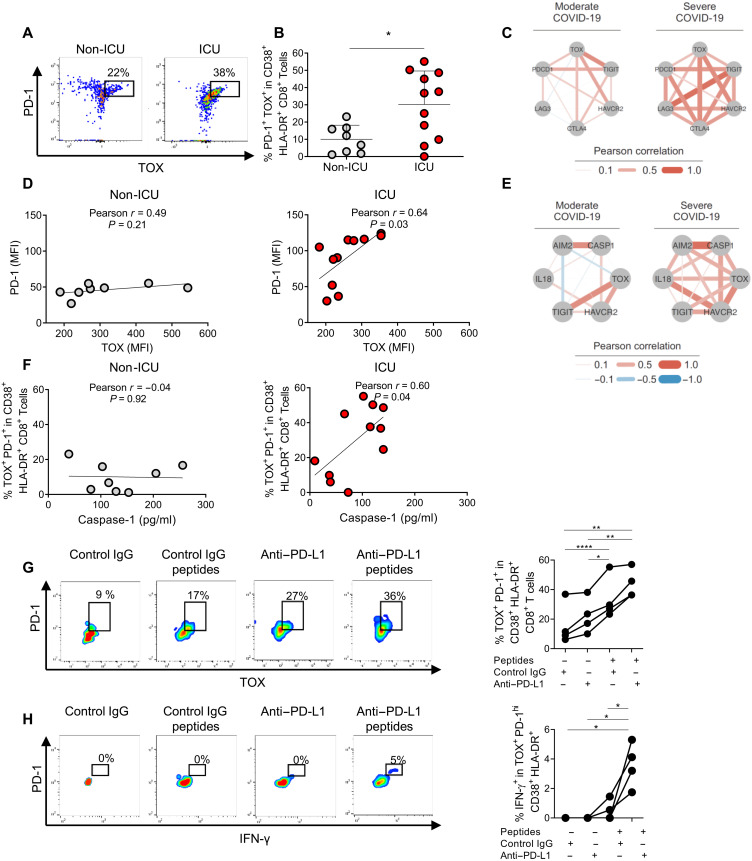
Fig. 4. Exhausted T cells correlate with plasmatic active caspase-1 in critical COVID-19 and can be modulated by anti–PD-L1 antibodies.
(A) Representative dot plots of a flow cytometry study of PD-1 and TOX in CD8+ TCR-β+ CD38+ HLA-DR+ cells in non-ICU and ICU patients. (B) The graphic shows the individual percentages of PD-1+ TOX+ cells within CD38+ HLA-DR+ CD8+ TCR-β+ for each studied patient. *P < 0.05, Student’s t test. (C) Network plot representing Pearson correlations of the indicated genes. Transcriptomic data from peripheral blood were analyzed from McClain et al. (46). (D) Correlation study between the MFI determined by flow cytometry of PD-1 and TOX within CD8+ TCR-β+ CD38+ HLA-DR+ cells in non-ICU and ICU patients. (E) Network plot representing Pearson correlations of the indicated genes. Transcriptomic data from peripheral blood were analyzed from McClain et al. (46). (F) Correlation study between the percentage of PD-1+ TOX+ cells in CD8+ TCR-β+ CD38+ HLA-DR+ cells and plasmatic active caspase-1 in non-ICU and ICU patients. (G) Flow cytometry study of the percentage of PD-1+ TOX+ cells within CD38+ HLA-DR+ CD8+ T cells from four lymphopenic ICU patients. Cells were incubated for 24 hours with control IgG (20 μg/ml; human IgG1) or anti–PD-L1 antibody. Then, 6 nmol of SARS-CoV-2 peptides was added or not to the culture for 6 hours. Representative dot plots are shown in the left panel. Data for the four studied patients are shown in the right panel. *P < 0.05; **P < 0.01; ****P < 0.0001, one-way ANOVA test. (H) Flow cytometry study of IFN-γ production by CD8+ TCR-β+ CD38+ HLA-DR+ PD-1+ TOX+ cells from the same ICU patients studied in (G) under the same in vitro treatments. Representative dot plots are shown in the left panel. Data for the four studied patients are shown in the right panel. *P < 0.05, one-way ANOVA test.

