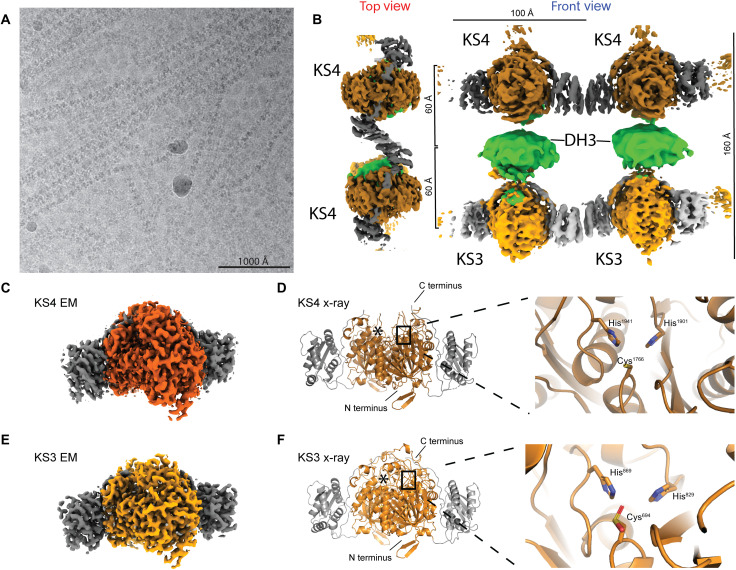
Fig. 2. Cryo-EM analysis of K3DAK4 filaments and individual bimodule cores.
(A) Cryo-EM micrograph from the filament dataset. (B) Hybrid representation of two adjacent bimodule cores within the filament assembled from two focused refinement maps for laterally linked pairs of KS3 (light gray/orange) and KS4 (dark gray/orange) dimers (maps 2 and 3 in fig. S1) and an excised region covering a pair of DH3 dimers (green) from an overall map of the bimodule core filament (map 1 in fig. S1). KS3 and KS4 form homotypic LINKS interactions. In the top view, the KS3 and DH domains are obscured by the KS4 domain (cf. also movie S1). (C to F) Structural analysis of dimeric KS3 and KS4 domains in isolation or in the context of K3DAK4 bimodule cores. (C) Cryo-EM map derived from focused refinement of KS4 in individual bimodule cores at 2.9-Å resolution. (D) X-ray crystallographic model of the isolated KS4 domain at 3.2-Å resolution. Notably, the area around the C terminus of KS4 is better ordered in the cryo-EM map (also see figs. S2 and S3A). (E) Cryo-EM map derived from focused refinement of KS3 in individual bimodule cores at 2.9-Å resolution. (F) X-ray crystallographic model of the KS3 domain at 1.6-Å resolution. The active site cysteine is oxidized in the crystal to a sulfinic acid. Asterisks in (D) and (F) depict position of the second protomers active site.

