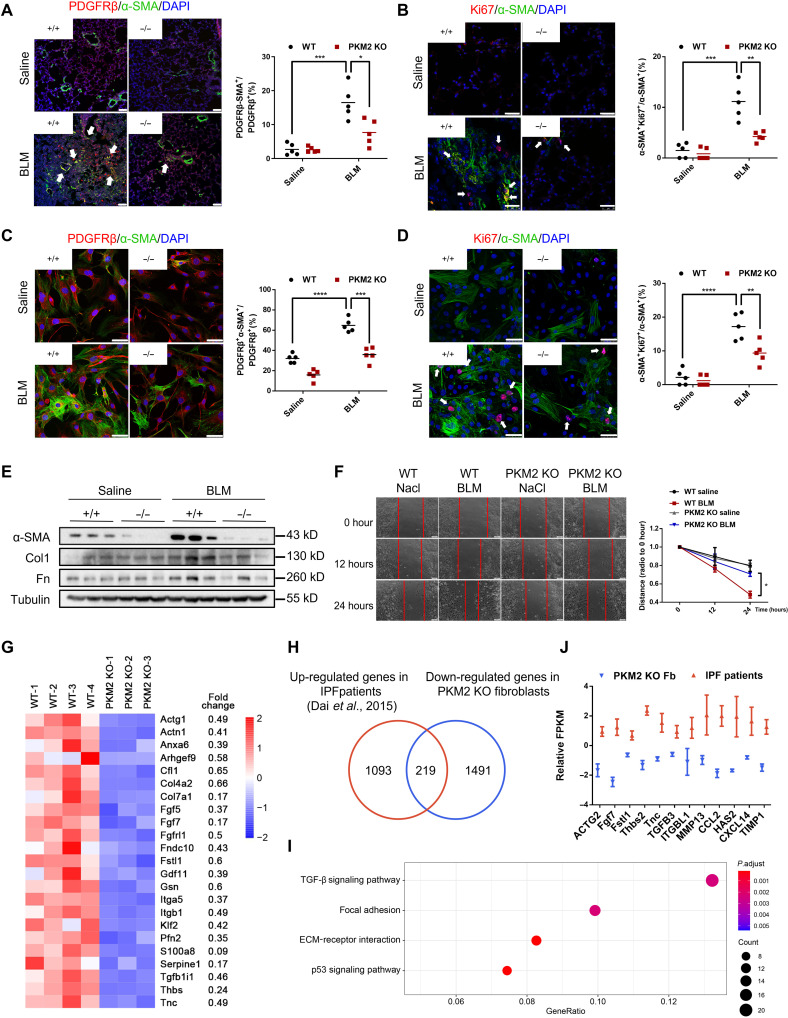
Fig. 3. Loss of PKM2 suppresses myofibroblasts activation.
(A and B) On day 21 after BLM induction, lungs were stained with antibodies against α-SMA and PDGFRβ (A) or antibodies against α-SMA and Ki67 (B) (n = 5 per group). White arrowheads indicate double positive cells. Scale bars, 50 μm (A) and 25 μm (B). (C and D) On day 21 after BLM induction, primary lung fibroblasts were isolated and stained with antibodies against α-SMA and PDGFRβ (C) or Ki67 (D) (n = 5 per group). White arrowheads indicate double positive cells. Scale bars, 5 μm. (E) Western blot analysis of α-SMA, Col1, and Fn expressions in primary lung fibroblasts isolated from control and PKM2-KO mice 0 and 21 days after BLM treatment. (F) On day 21 after BLM induction, primary lung fibroblasts were isolated and seeded in a plate. When cells were fully confluent, a scratch was made in the center of the culture well. Images were obtained at 0, 12, and 24 hours. Three parallel lines were drawn, and images were analyzed using Image-Pro Plus software. (G) Heatmap of significantly down-regulated (<1.5-fold change) genes in PKM2-KO fibroblasts compared with WT fibroblasts. (H) Among 1710 down-regulated genes in PKM2-KO fibroblasts, 219 genes are up-regulated in patients with IPF. (I) Also shown is a Kyoto Encyclopedia of Genes and Genomes (KEGG) pathway enrichment analysis of these 219 commonly genes. (J) Representative down-regulated genes in PKM2-KO fibroblasts that were up-regulated in patients with IPF. Data are represented as the means ± SEM. *P < 0.05; **P < 0.01; ***P < 0.001; ****P < 0.0001, Student’s t test.

