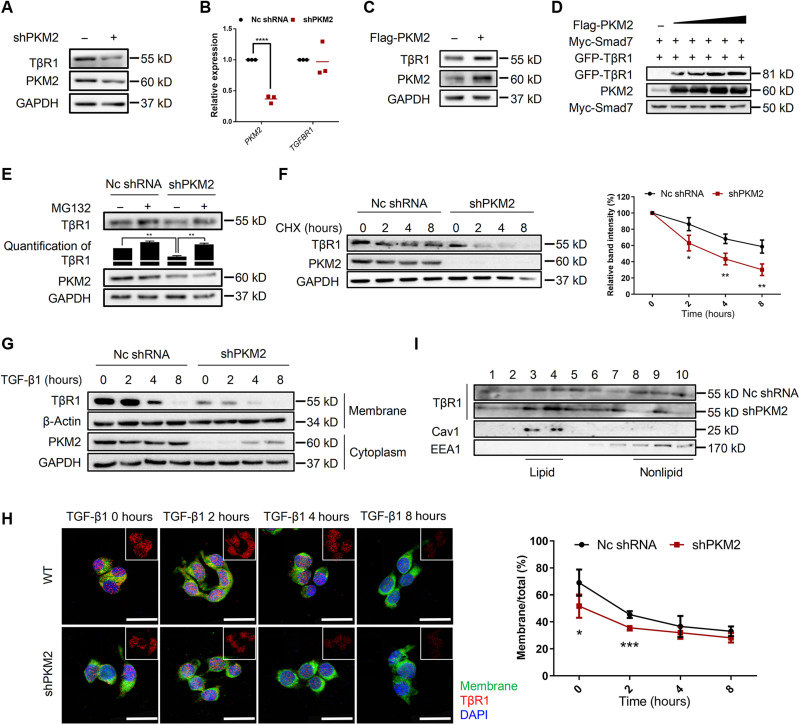
Fig. 6. PKM2 stabilizes TβR1 on the membrane.
(A) Western blot analysis of TβR1 expression in 293T cells transfected with shPKM2. (B) qRT-PCR analysis of TGFBR1 mRNA expression in 293T cells transfected with shPKM2. GAPDH mRNA levels were used as an internal normalization control (n = 3 per group). (C) Immunoblot analysis of TβR1 expression in 293T cells transfected with Flag-PKM2. (D) Immunoblot analysis of 293T cells transfected with Myc-Smad7, GFP-TβR1, and increasing amount of Flag-PKM2. (E) Representative immunoblot analysis of TβR1 in 293T cells transfected with shPKM2 in the presence or absence of MG132. (F) Immunoblot analysis of TβR1 in 293T cells transfected with shPKM2 in the presence or absence of cycloheximide. (G) 293T cells were transfected with shPKM2 and treated with TGF-β1, and membrane and cytoplasmic proteins were separated and subjected to immunoblot analysis. (H) 293T cells were transfected with shPKM2 and treated with TGF-β1. Membrane was stained with CellMask, and TβR1 was stained with anti-TβR1 antibody. Scale bars, 25 μm. The ratio of membrane TβR1 was shown as percentage. (I) TβR1 distribution in lipid and nonlipid fractions was analyzed in 293T cells transfected with shPKM2 and subjected to sucrose gradient subcellular fractionation to separate lipid rafts from other cellular components. An equal volume from each fraction was analyzed by immunoblot analysis. Data are represented as the means ± SEM. *P < 0.05; **P < 0.01; ***P < 0.001; ****P < 0.0001, Student’s t test.

