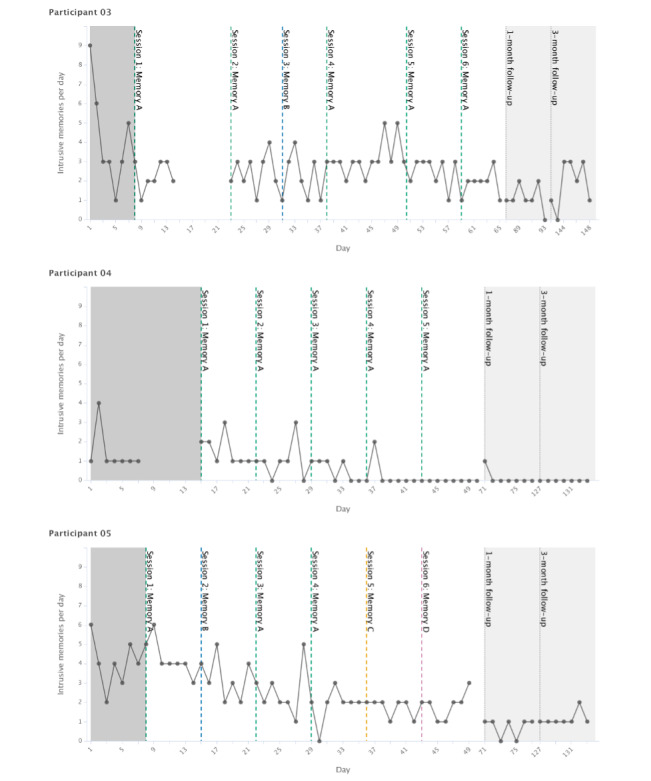
Figure 2.

Graphs for visual inspection of primary outcome data for each participant (on the y-axis as total number of intrusive memories per day, ie, for all distinct memories combined). Days since study start are shown on the x-axis, which includes baseline (gray), intervention (white), and follow-up periods (light gray). Dashed vertical lines show when each intervention session was administered and which specific traumatic memory was targeted. Memories are labeled in order of when they were targeted (eg, Memory A was targeted in the first intervention session). Dotted vertical lines show the 1-month and 3-month follow-up periods. Gaps in the time series; for example, in the baseline, represent missing data.
