
Fig. 4.
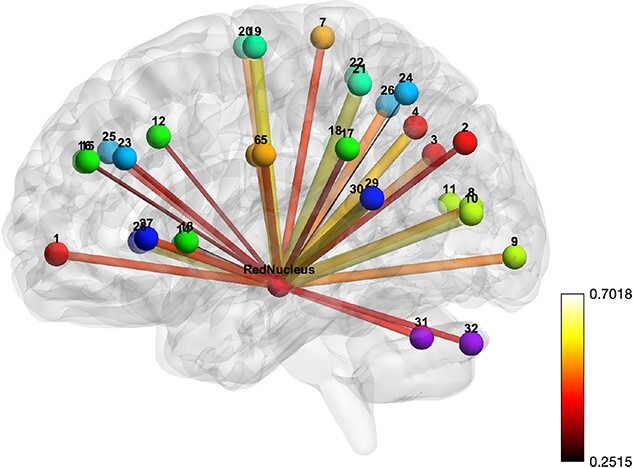
RN network. The bars represent the association of the edges with an IRI and the strength of association is represented by the thickness and color of the bar. Balls represent the centers of brain regions, each labeled by a distinct color. The color bar stands for correlation value.