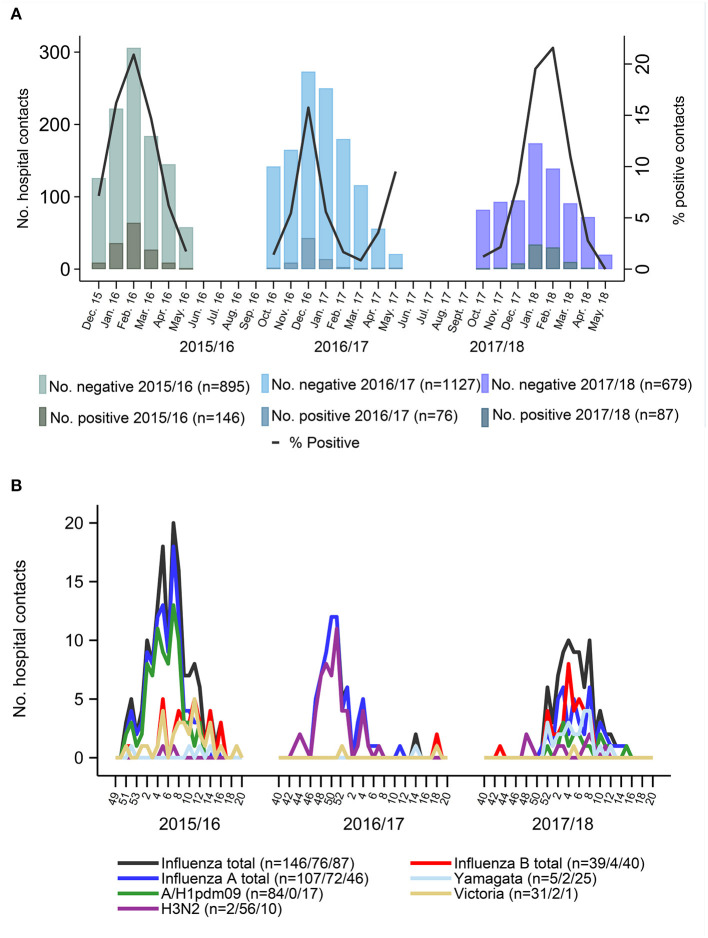
Figure 2.
(A) Number of Influenza tested participants, and positivity rate through three influenza seasons. (B) Occurrence of influenza subtypes throughout three surveillance seasons. Black lines are the sum of all influenza cases per week. Blue lines are the sum of all influenza a cases and red line is the sum of all influenza b cases. Not all cases were fully typed due to shortage of material or low viral titers.

