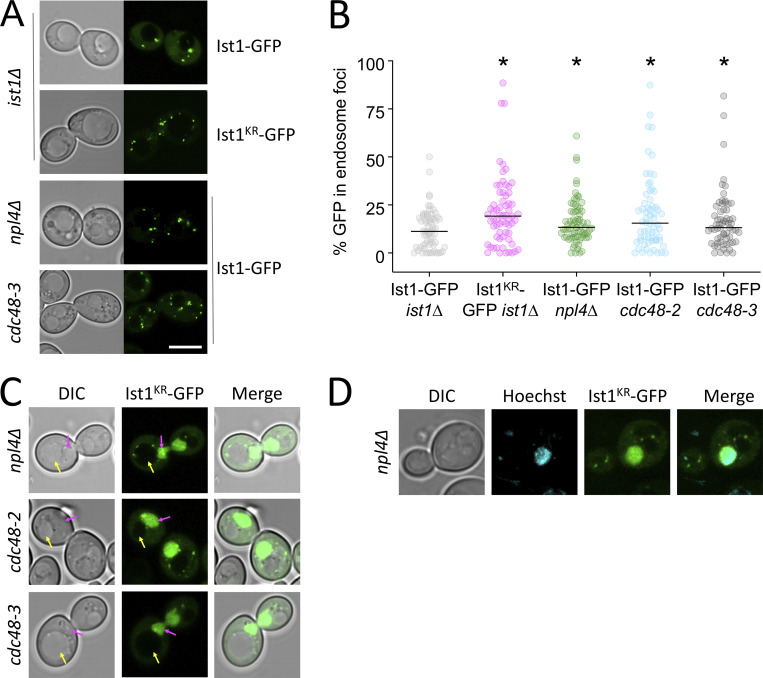
Figure S5.
Ist1 localizations in vivo. (A) Indicated strains expressing Ist1WT-GFP and Ist1KR-GFP were imaged by Airyscan microscopy. (B) The percentage GFP signal in endosomal foci quantified as a percentage of total cellular fluorescence. (C) Ist1KR-GFP mislocalizes to the nucleus (pink arrow or Hoechst stain) in indicated mutants. (D) Airyscan microscopy used to localize indicated fluorescent proteins in WT cells. Scale bar, 5 µm.

