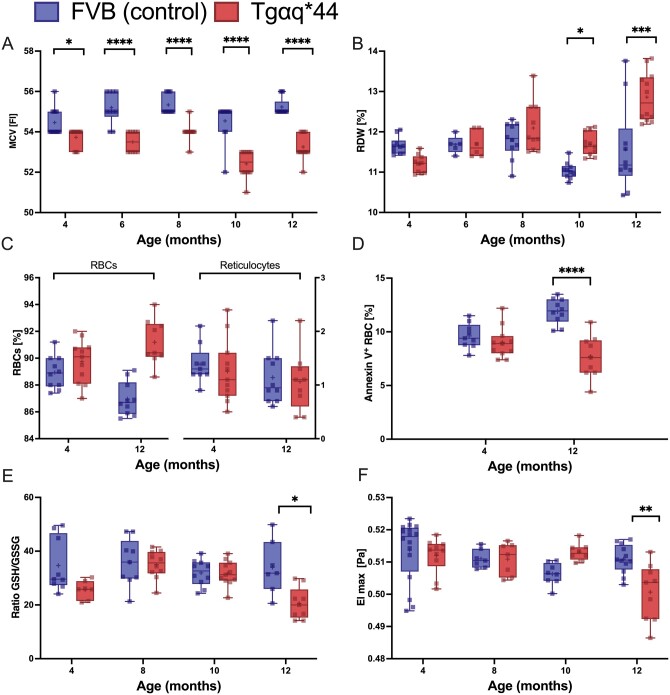
Figure 3.
Alteration in blood count, apoptotic RBCs, GSH/GSSG ratio (oxidative stress), and erythrocyte deformability with the progression of HF in Tgαq*44 mice compared with age-matched FVB mice. The MCV (n = 11–12) (A) and RDW (n = 10–12) (B) in the blood in 4-, 6-, 8-, 10-, and 12-month-old Tgαq*44 mice vs. FVB controls mice. The percentage of RBCs and reticulocytes (n = 9–11) (C), and the number of apoptotic RBCs (n = 9–11) (D) in the blood samples in 4- and 12-month-old Tgαq*44 mice vs. FVB mice. The glutathione redox ratio (GSSG·GSH−1) (n = 7–10) (E), RBCs deformability (n = 7–12) (F) at shear stress (20 Pa) in the RBCs in 4-, 8-, 10-, and 12-month-old Tgαq*44 mice vs. FVB controls mice. Normality was assessed using a Shapiro–Wilk test. Results are presented as box plots (median, Q1, Q3, whiskers indicate minimum/maximum). Q1 and Q3 indicate the 25th and 75th percentiles, respectively. *P < 0.05, **P < 0.01, ***P < 0.001, ****P < 0.0001, Tgαq*44 mice compared with age-matched FVB controls using two-way ANOVA with post hoc Sidak test.; MCV, mean corpuscular volume; RBC, red blood cell; RDW, red blood cell distribution width.

