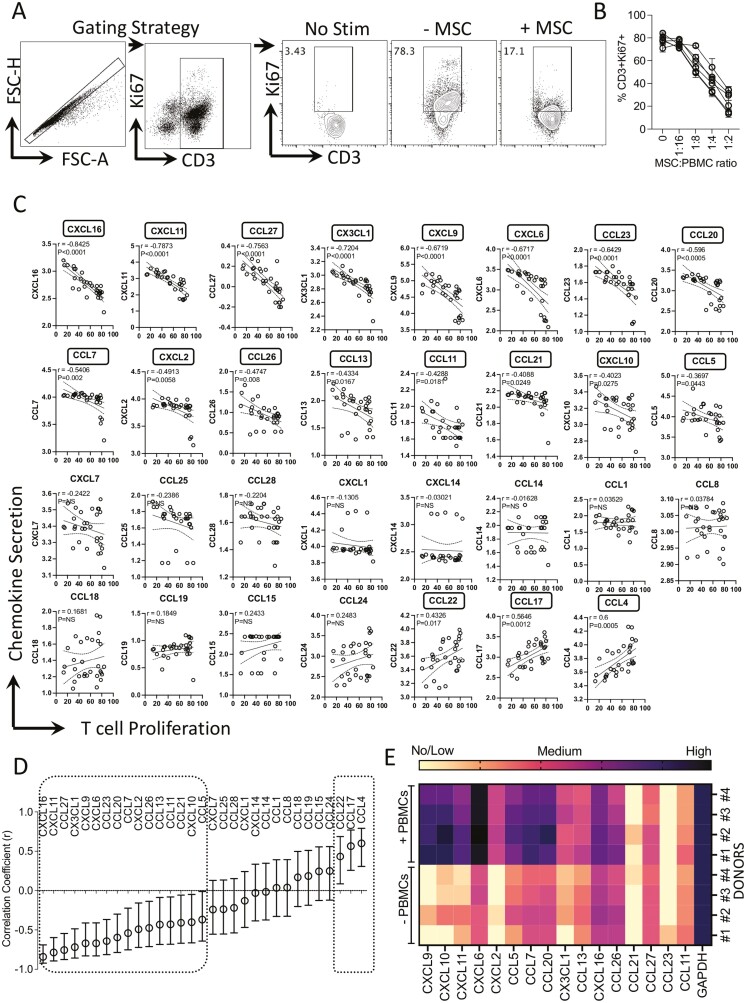
Figure 5.
Matrix chemokine signatures of human bone marrow MSC and PBMC interactions. MSCs derived from six independent donors were cultured with SEB-activated PBMCs at the indicated ratios. PBMC numbers were kept constant with dose-dependent increase in MSC numbers. Four days post-culture, T-cell proliferation was measured by determining the percentage of CD3+ Ki67+ cells using flow cytometry. (A) Representative flow cytometry plot and gating strategy are shown for CD3 and Ki67 staining. NS indicates no stimulation of PBMCs. − and +MSCs indicate SEB-activated PBMCs cultured without and with MSCs. (B) Dose-dependent effect of MSCs from independent donors in inhibiting T-cell proliferation is cumulatively shown. Supernatants were collected from these cultures and quantitative levels (pg/mL) of chemokines were assayed through Luminex xMAP (multi-analyte profiling) technology. Individual chemokine levels of MSC and PBMC coculture were subjected to linear regression analysis with the corresponding T-cell proliferation values (%CD3+ Ki67+) to obtain correlation coefficient r values. r value of 1 and −1 indicates the best direct and inverse correlations, respectively, while 0 indicates no correlation. (C) Linear regression plots were organized hierarchically based on the correlation coefficient (r) ranking scale of −1 to +1. X-axis indicates %CD3+ Ki67+ cells (T-cell proliferation) and y-axis indicates chemokine levels. y-axis data are transformed to logarithmic scale to best fit linear regression lines. (D) Hierarchical organization of correlation coefficient values with appropriate range of 95% confidence intervals for each chemokine is shown in the scale of −1 to +1. Statistical significance (P < .05) or non-significance (NS) of the r values are shown. (E) MSCs with and without SEB-activated PBMCs were cocultured in a non-contact dependent two-chamber transwell assay system. Three days later, MSCs were harvested to isolate total RNA, and cDNA was prepared. Quantitative PCR was performed to determine the levels of chemokine expression. Heat map depicts the low, medium, and high expression of chemokines based on the relative cycle of threshold values. Cumulative results are shown from four independent experiments (n = 4 independent donors).

