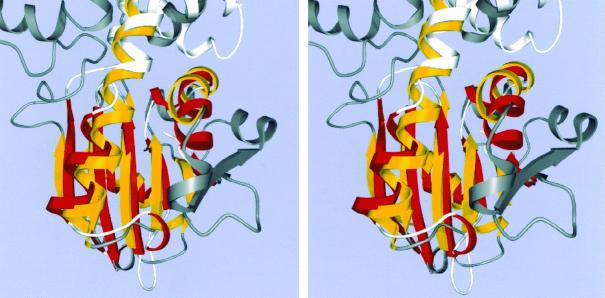
FIG. 3.
Stereoview of the superposition of the C-terminal domains of acetate kinase and of Hsc 70. The conserved ASHKA core is colored yellow for acetate kinase (with the remainder dark gray) and red for Hsc 70 (with the remainder white). The graphics program O was used to calculate the superposition matrix. The terminal helix, which extends into the N-terminal domain, is not shown.

