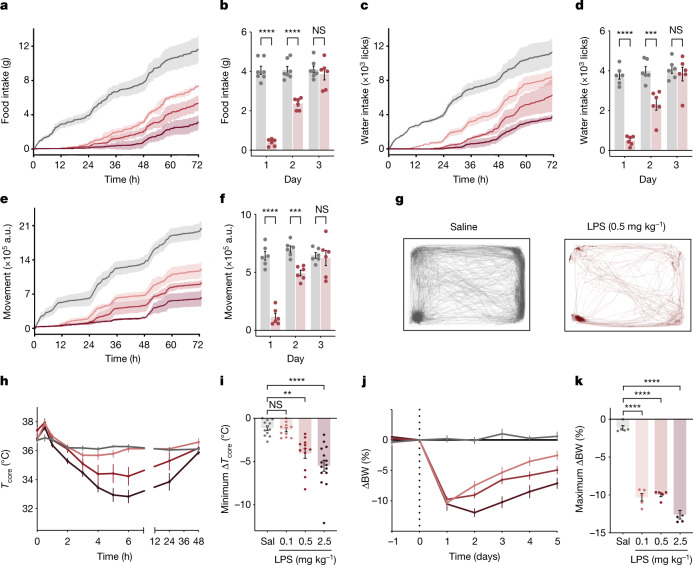
Fig. 1. LPS induces coordinated, dose-dependent behavioural and thermal changes.
a,c,e, Cumulative food intake (a), water intake (c) and movement (e) for 72 h after injection of saline (grey; N = 7) or LPS at 0.1 mg kg−1 (light red; N = 6), 0.5 mg kg−1 (middle red; N = 6) or 2.5 mg kg−1 (dark red; N = 6). Solid line, mean; shaded area, 95% confidence interval. b,d,f, Food intake (b), water intake (d) and movement (f) for each day post injection with saline (grey) or 0.5 mg kg−1 LPS (red). For all three parameters, there were significant reductions on the first and second days post LPS injection, but full recovery by the third day (two-way ANOVA first day: food intake P < 1 × 10⁻⁷, water intake P < 1.6 × 10⁻⁶, movement P = 3 × 10⁻⁶). g, Movement trace for the first 24 h post saline or LPS (0.5 mg kg−1) for a representative mouse. h, Time course of the core temperature (Tcore) for 48 h after injection of saline (grey; N = 12) or LPS at 0.1 mg kg−1 (light red; N = 11), 0.5 mg kg−1 (middle red; N = 12) or 2.5 mg kg−1 (dark red; N = 15). Points, mean; error bars, s.e.m. i, Minimum change in Tcore for each dose at 48 h post injection (two-way ANOVA: 0.1 mg kg−1 P = 1.0, 0.5 mg kg−1 P = 2.8 × 10⁻³, 2.5 mg kg−1 P = 4.9 × 10⁻⁵; colours as in h; Sal, saline). j, Percentage change in body weight (BW) from day 0 (baseline) for animals injected with saline or LPS (0.1 mg kg−1, n = 6; 0.5 mg kg−1, n = 6; and 2.5 mg kg−1, n = 6; colours as in h) on day 0. k, Maximal percentage decrease in body weight following injection (two-way ANOVA: P < 1 × 10⁻⁷ for 0.1 mg kg−1, 0.5 mg kg−1 and 2.5 mg kg−1; colours as in h). **P < 0.01, ***P < 0.001, ****P < 0.0001 and NS, not significant (P > 0.05). All error bars represent the s.e.m.

