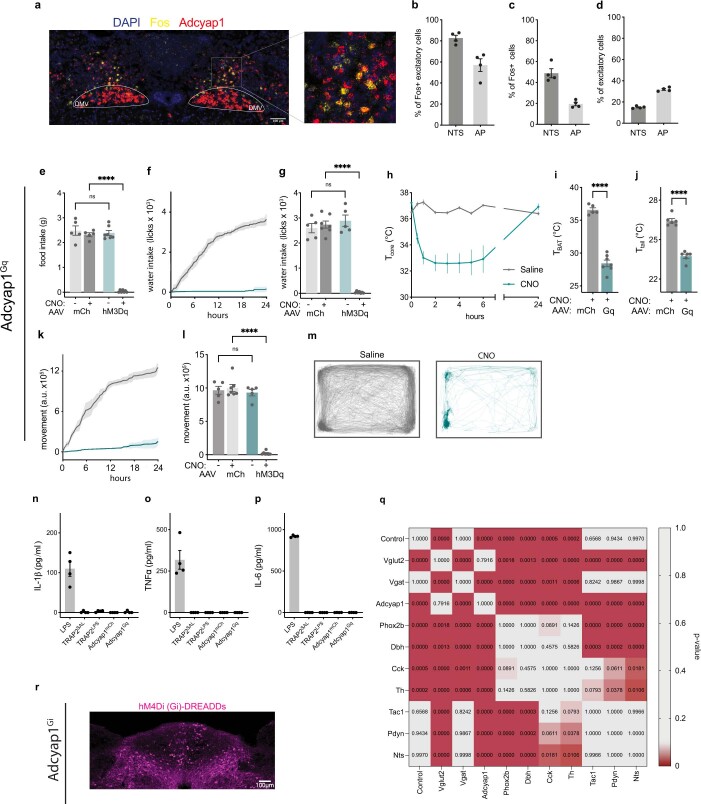
Extended Data Fig. 5. Functional characterization of cell types in NTS/AP region.
a, Representative RNAscope image of DAPI (blue), Fos (yellow), and Adcyap1 (red) staining in the NTS/AP of animals two hours after treatment with 0.5mg/kg of LPS. b, Quantification of % of Fos+ excitatory cells coexpressing Adcyap1 in the NTS and AP after LPS treatment. c, Quantification of % of Fos+ cells coexpressing Adcyap1 in the NTS and AP after LPS treatment. d, Quantification of % of all excitatory cells expressing Adcyap1 in the NTS and AP. e,g,i, Total 12 h food intake (e), water intake (g), and movement (i) for mCherry virus injected animals (grey) and activating hM3Dq DREADDs injected animals (cyan). f,k, Cumulative water intake (f) and movement (k) for saline (grey) or CNO (cyan) injection. m, Movement trace for first 24 h post saline (grey) or CNO (cyan) for representative mouse. h, Core temperature time course for 24 h after injection of saline (grey) or CNO (cyan). i,j, BAT temperature (i) and tail temperature (j) four hours after injection of CNO for mCherry virus injected animals (grey) and activating hM3Dq DREADDs injected animals (cyan). Unpaired t-test BAT temperature P < 1x10⁻⁷; unpaired t-test tail temperature P = 3.8x10⁻⁷. n-p, Serum levels of IL-1β (n), TNFα (o), and IL-6 (p), after LPS treatment, and CNO treatment for: saline labeled TRAP2 cells expressing cre dependent Gq DREADDs; LPS labeled TRAP2 cells expressing cre dependent Gq DREADDs, Adcyap1-cre injected with cre dependent mCherry, and Adcyap1-cre injected with cre dependent Gq-DREADDs. q, P-value statistics from two-way ANOVA comparing food intake of cre lines to one another from Fig. 5v. r, Representative image of an Adcyap1-cre injected with cre-dependent Gi-DREADDs. hM4Di-mCherry, magenta. ****P < 0.0001 and NS, not significant (P > 0.05). All error bars represent s.e.m.

