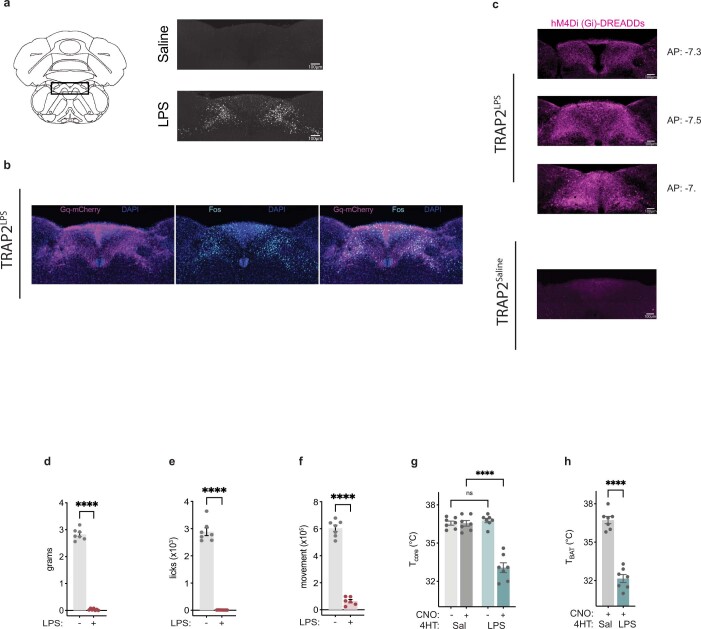
Extended Data Fig. 3. TRAP2 experiment additional information.
a, FOS staining of NTS/AP of saline and LPS (0.5mg/kg) treated animals three hours after injection. b, TRAP2 labeling in NTS/AP region of LPS-labeled animals. Gq-mCherry, purple; Fos, cyan; DAPI, blue. c, Representative images of TRAP2 labeling in NTS/AP region of LPS labeled (top) and saline labeled (bottom) with cre-dependent Gi-DREADDs. Top three panels show 4-hydroxytamoxifen labeling with LPS for three anterior-posterior coordinates in a single animal while bottom panel shows labeling with saline. hM4Di-mCherry, magenta. d–f, food intake (d), water intake (e), and movement (f) for 0.5mg/kg of LPS from Fig. 1 experiment to serve as reference. g,h, Core temperature (g) and BAT temperature (h) at four hours post CNO injection for reactivation of saline labeled (dark gray) and LPS labeled (dark cyan) neurons. Saline treatment is shown for core temperature in light gray and light cyan. Two-way ANOVA core temperature P < 1x10⁻⁷; unpaired t-test BAT temperature P < 1x10⁻⁷). ****P < 0.0001 and NS, not significant (P > 0.05). All error bars represent s.e.m. The brain illustration in a was created using BioRender.com.

