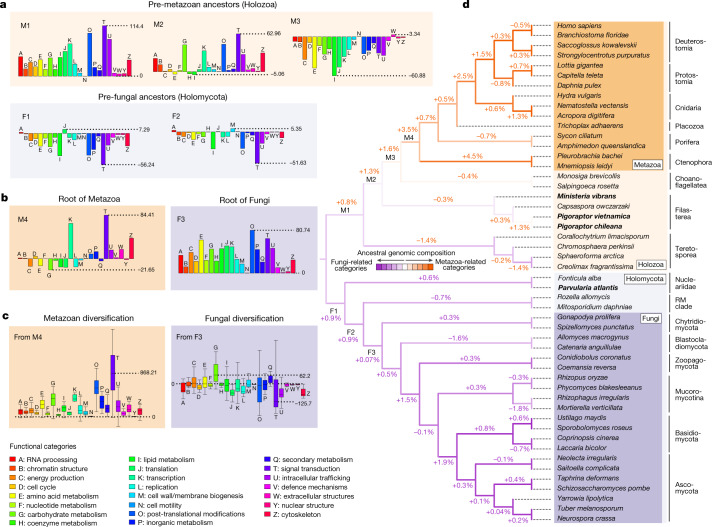
Fig. 1. Lineages leading to modern Metazoa and Fungi experienced sharply contrasting trajectories of genetic changes.
a,b, Net gains and losses of ‘Cluster of Orthologous Groups’ categories with functional information (hereafter referred to as functional categories) since the divergence of Opisthokonta to the emergence of both groups. See Extended Data Fig. 4 for full category names and for information on the other ancestral nodes. c, Boxplot distribution of the cumulative net gains and losses of functional categories that occurred in each of the ancestral paths leading to the extant representatives of Metazoa (n = 15) and of Fungi (n = 21) since the origin of both groups (Supplementary Tables 1 and 2). Outliers are not represented, but a fully displayed version of c is available in Supplementary Fig. 1. Note that, on average, Metazoa tended to accumulate genes for every functional category, whereas only a few categories experienced net gains in the path to modern Fungi. d, Changes in functional category composition during the evolution of Opisthokonta, with percentages indicating the magnitude of change in each ancestor (Supplementary Table 3). Metazoa-related and Fungi-related categories are indicated in Fig. 2a. The cladogram shown was reconstructed based on the most supported topologies found for Holozoa and Holomycota in the phylogenetic analyses (Supplementary Information 3). Genomic data were produced for the four species in bold.

