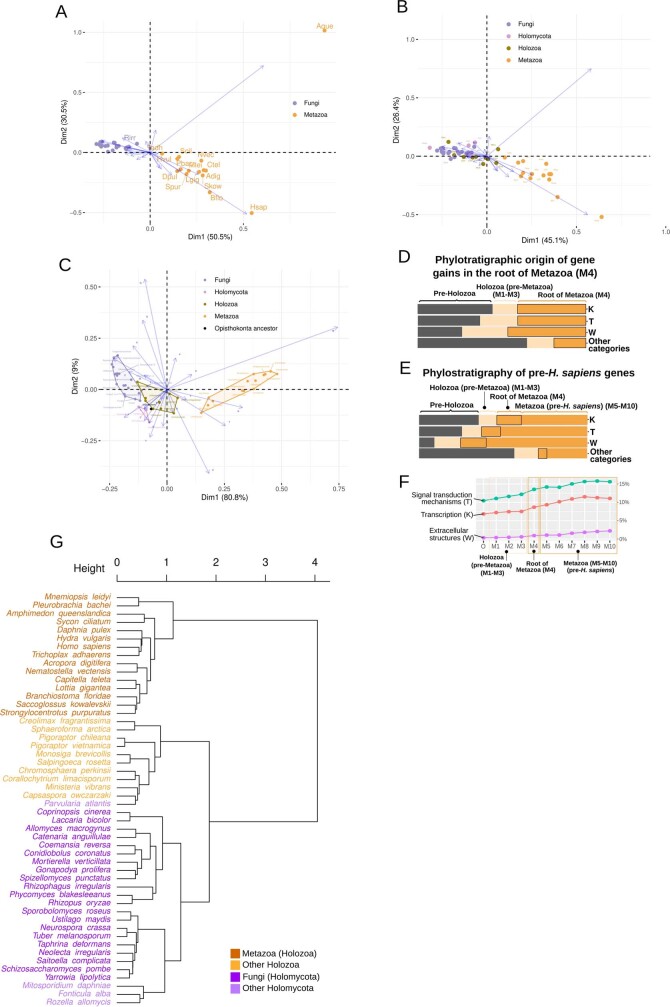
Extended Data Fig. 6. Correspondence analyses contribution biplots on functional category compositions in Opisthokonta, phylostratigraphic analyses of functional category changes in the evolutionary path towards extant Metazoa and clustering of Opisthokonta species based on gene family content composition.
Correspondence Analyses contribution biplot for the relative representation of functional categories (Supplementary Table 7) in the species from euk_db dataset representing (A) Metazoa and Fungi (B) Opisthokonta (i.e., Metazoa, Fungi, and also the other Holozoa and Holomycota sampled, Supplementary Table 4), and (C) every ancestor represented by an internal node in the Opisthokonta phylogeny (see Fig. 7 in Supplementary Information 3 for a mapping of every ancestral lineage to the phylogeny). (D) Phylostratigraphic origin of each functional category for those gene families that experienced increments in copy number (either gene gains or gene originations) in the last common ancestor of Metazoa for each functional category (Supplementary Table 12). (E) Phylostratigraphy of the ancestral gene content of Homo sapiens for each functional category (Supplementary Table 11). (F) Increment in the relative representation of functional categories which are particularly important for animal multicellularity since the divergence of Opisthokonta (Supplementary Table 13). (G) Similarities in gene family (orthogroups) composition between all the Opisthokonta species included in our study. We first computed the raw similarity value for each pair of species by inspecting those gene families found in both species and adding up for each of these families the lowest copy number value found among the two species. Each raw similarity value was then normalized by multiplying it by two and dividing it by the maximum possible similarity value that could have been found for that pair of species, which corresponds to the sum of members that every gene family has in the two species (species-specific families were not considered) (Supplementary Table 14). The dendrogram was reconstructed using the 'ward.D' method from the R package hclust.

