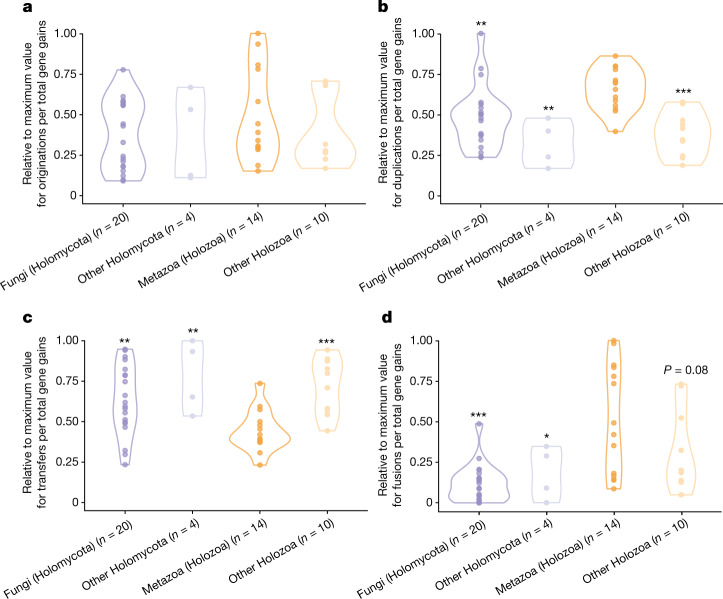
Fig. 3. Taxonomic differences in the relative contribution of gene originations, gene duplications, horizontal gene transfers and gene fusions to gene gains.
a–d, Dots correspond to the percentage of gene gains explained by each mechanism in every ancestral lineage of Opisthokonta (Supplementary Table 6; values were normalized to the maximum value found in each plot for a better representation of differences between groups). For every plot, the asterisks indicate the groups that present significantly lower (b and d) or higher (c) distribution of values than Metazoa (Holozoa), according to one-tailed Mann–Whitney U-test results. *P ≤ 0.05, **P ≤ 0.01 and ***P ≤ 0.001 (see exact P values in Supplementary Table 6).

