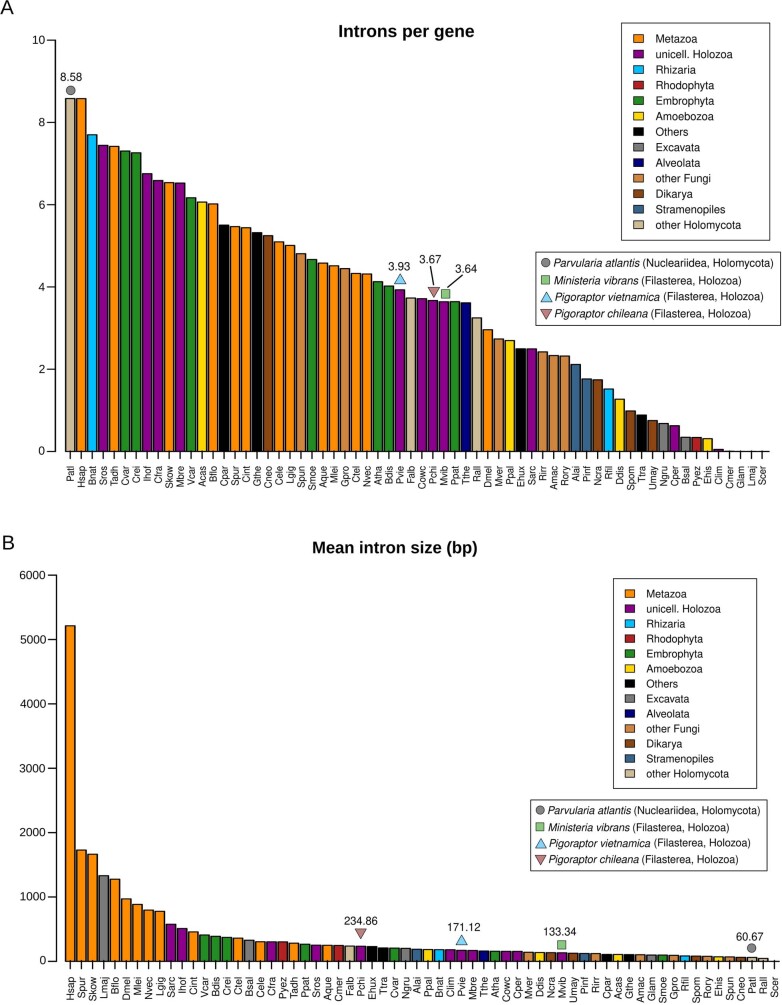
Extended Data Fig. 3. Intron per gene and mean intro size metrics in eukaryotes.
Distrubtion of (A) 'Introns per gene' and (B) 'Mean intron size (bp)' in an eukaryotic dataset including the four genomes produced as well as the metrics included in the Fig. 1—source data 1 of ref. 18. Whereas a potential loss of non-coding regions in the P. atlantis genome during the metagenome decontamination could have led to an underestimation of the genome size metric, the high ratio of introns per gene and the small size of introns found strongly suggests that the intron-richness of this nucleariid is not an artefactual result.

