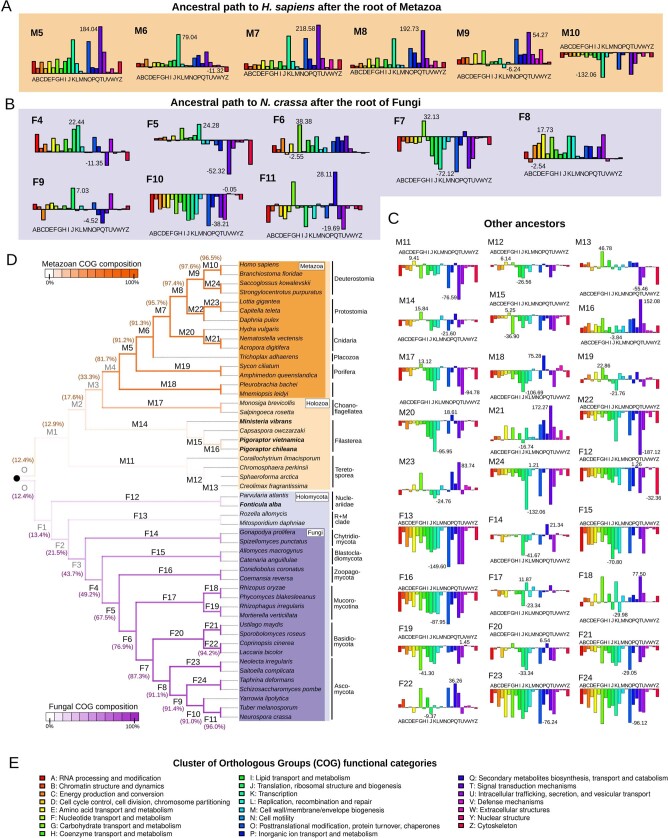
Extended Data Fig. 4. Evolution of functional category composition in Opisthokonta.
(A–C) Net gains and losses of functional categories in those ancestral nodes that are not represented in Fig. 1. (D) Consensus phylogeny of Opisthokonta as reconstructed from the phylogenetic analyses (Supplementary Information 3). Genomic data was produced for the four species in bold. Branch colors correspond to the weighted average probability retrieved for every ancestor (internal branches) by the machine-learning classifiers that were trained to detect differential COG-compositional features of extant Metazoa and of Fungi (see Methods). Branch colors in the Holozoa clade represent the weighted averages from the metazoan predictors, and in the Holomycota clade the weighted average from the fungal predictors (Supplementary Table 5). (E) Cluster of Orthologous Groups (COG) categories with functional information (referred to as functional categories along the manuscript).

