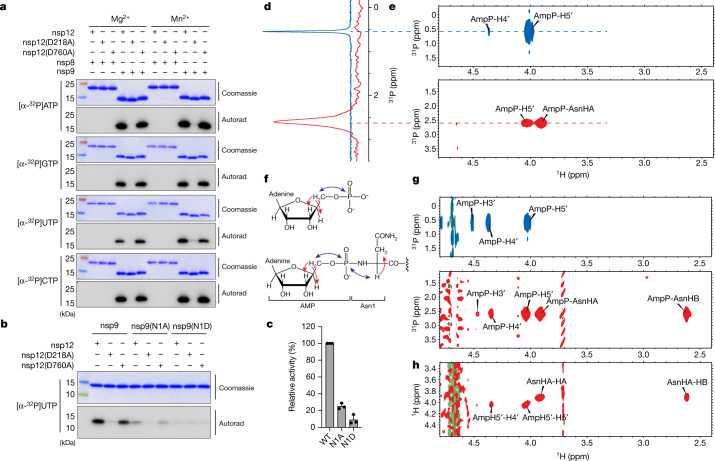
Fig. 1. The NiRAN domain NMPylates the N terminus of nsp9.
a, Incorporation of α-32P from [α-32P]ATP, GTP, UTP or CTP into nsp8 or nsp9 by WT nsp12, the NiRAN mutant (D218A) or the polymerase mutant (D760A). Reactions were performed in the presence of Mg2+ or Mn2+, and the products were resolved by SDS–PAGE and visualized by Coomassie staining (top) and autoradiography (autorad; bottom). b, Incorporation of α-32P from [α-32P]UTP into nsp9 or the indicated mutants by the NiRAN domain. The reaction products were analysed as described in a. c, Quantification of reaction products shown in b depicting the relative NiRAN-dependent UMPylation activity towards nsp9 or the indicated mutants. Radioactive gel bands were excised and quantified by scintillation counting. d, One-dimensional 31P spectrum of AMP–nsp9 (red) and AMP (blue) recorded in the same buffer as the reference. e, 2D 1H, 31P-HSQC spectra of AMP (top, blue) and AMP–nsp9 (bottom, red). f, The structure of AMP (top) and AMP–nsp9 (bottom) with arrows to indicate the magnetization transfer steps that result in the peaks observed in the 2D NMR spectra. The blue arrows indicate the transfer steps that yield the peaks in the HSQC spectra, and the red arrows show the additional magnetization transfer during the TOCSY that result in the additional peaks found in the HSQC–TOCSY spectra. g, 2D 1H,31P-HSQC–TOCSY spectra of AMP (top, blue) and AMP–nsp9 (bottom, red). h, 2D 1H,1H-HSQC–TOCSY spectra of AMP–nsp9. For a–c, the results are representative of at least three independent experiments. For c, data are mean ± s.d.

