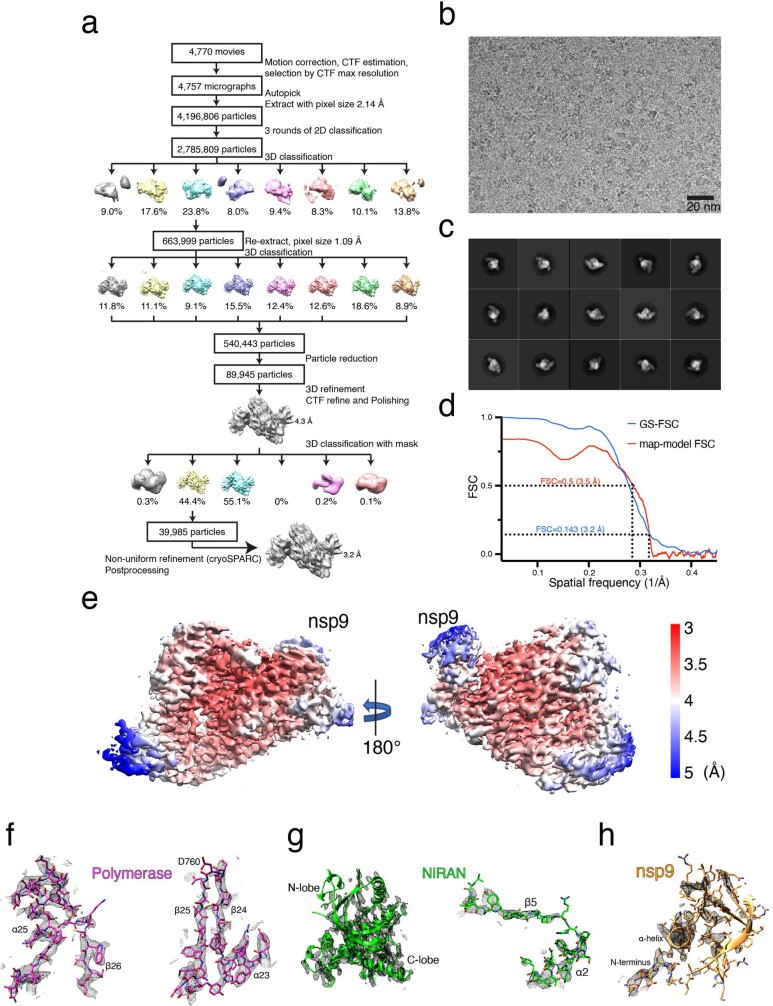
Extended Data Fig. 7. Cryo-EM analysis of the nsp7/8/9/12 complex.
a. Flow chart representing data processing for the nsp7/8/9/12 complex. b. A representative micrograph of the nsp7/8/9/12 complex grids. c. Representative 2D classes generated by RELION 2D-classification. d. Gold-standard FSC curve (blue), and map-model FSC curve (red). Curves were generated by cryoSPARC and Phenix suite, respectively. e. Local resolution of the nsp7/8/9/12 complex calculated by RELION from final cryoSPARC half-maps. Position of nsp9 is indicated. f-h. Exemplary cryo-EM density (black mesh) on (f) Polymerase (Magenta), (g) NiRAN (green) and (h) nsp9 (gold). Note weaker density in the N-lobe of the kinase-like NiRAN domain (left panel of g, compare top to bottom of the image), and poor density in nsp9 (h), in areas not in direct contact with the NiRAN domain.

