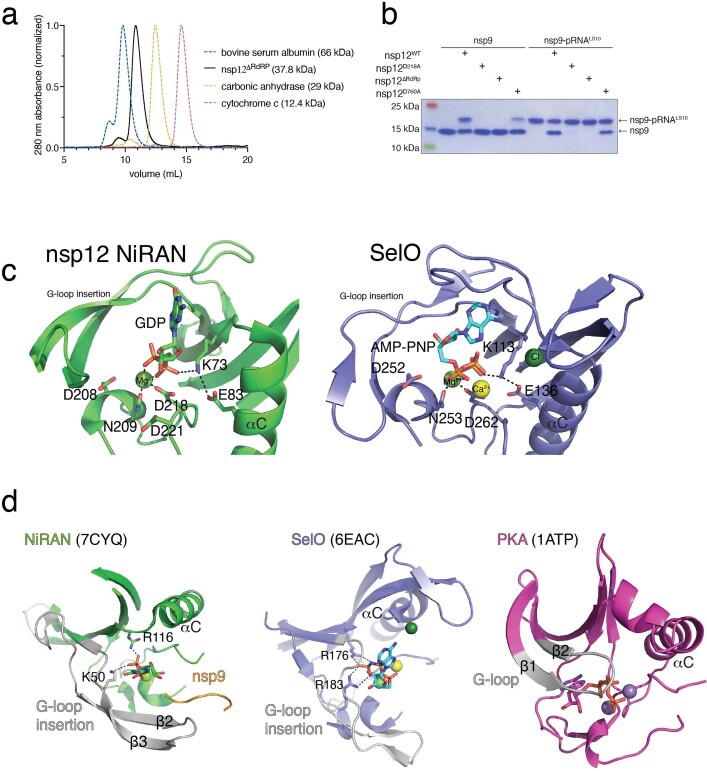
Extended Data Fig. 8. Biochemical analysis of the isolated NiRAN domain and comparison of the kinase-like domains of nsp12 and SELO.
a. Size exclusion chromatography analysis of the isolated NiRAN domain (residues 1–326; ∆RdRp). Standards are shown. b. Incorporation of 5′-pRNALS10 into nsp9 and deRNAylation of nsp9–pRNALS10 by WT nsp12, the NiRAN mutant (D218A), the polymerase mutant (D760A), or the ∆RdRP mutant. Reaction products were analysed as in Fig. 2b. c. Cartoon representation comparing the NiRAN active site catalytic residues (green) to the active site residues in SELO (purple). The divalent cations are shown as spheres. d. Comparison of the Gly-rich loop regions in NiRAN (PDB: 7CYQ; left), SELO (PDB: 6EAC), and the canonical kinase PKA (PDB: 1ATP; right). Green sphere – Mg2+, dark green sphere – Chloride, yellow sphere – calcium, violet sphere – Mn2+.

