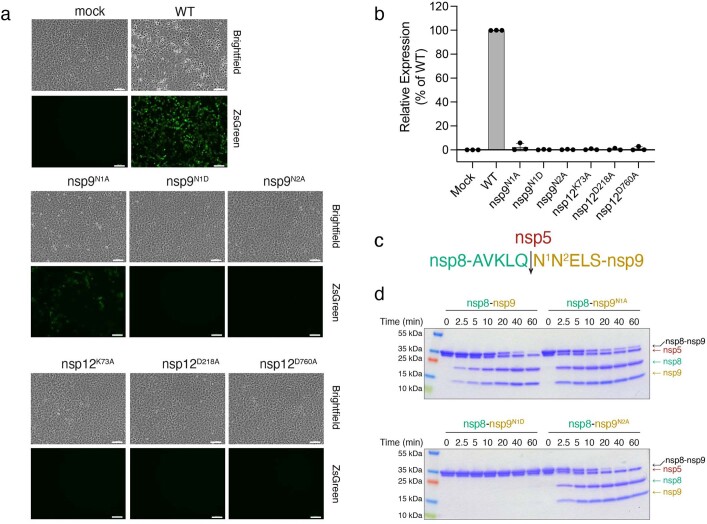
Extended Data Fig. 9. Genetic insights into RNA capping by the NiRAN domain.
a. Microscopy images showing brightfield (upper) or fluorescence-based images (ZsGreen; lower) of SARS-CoV-2-ZsGreen production in VeroE6-C1008-TMPRSS2 cells. Mock-transfected panels were incubated with transfection reagents lacking DNA. The mutations engineered into either nsp9 or nsp12 are indicated above each set of images. Data are one set of images representative of three independent biological replicates. b. Relative viral yields from WT or mutant SARS-CoV-2 viruses bearing indicated mutations in nsp9 and nsp12. Viral RNA levels were quantified by RT-qPCR. Bars: mean ± SD of N = 3 biological replicates. c. The amino acid sequence between nsp8 (green) and nsp9 (gold) depicting the cleavage site for the nsp5 (dark red) protease. N1 and N2 of nsp9 are highlighted. The arrow denotes the location of cleavage. d. Time-dependent proteolysis of the nsp8-nsp9 fusion protein by nsp5. Reaction products were separated by SDS PAGE and visualized by Coomassie staining.

