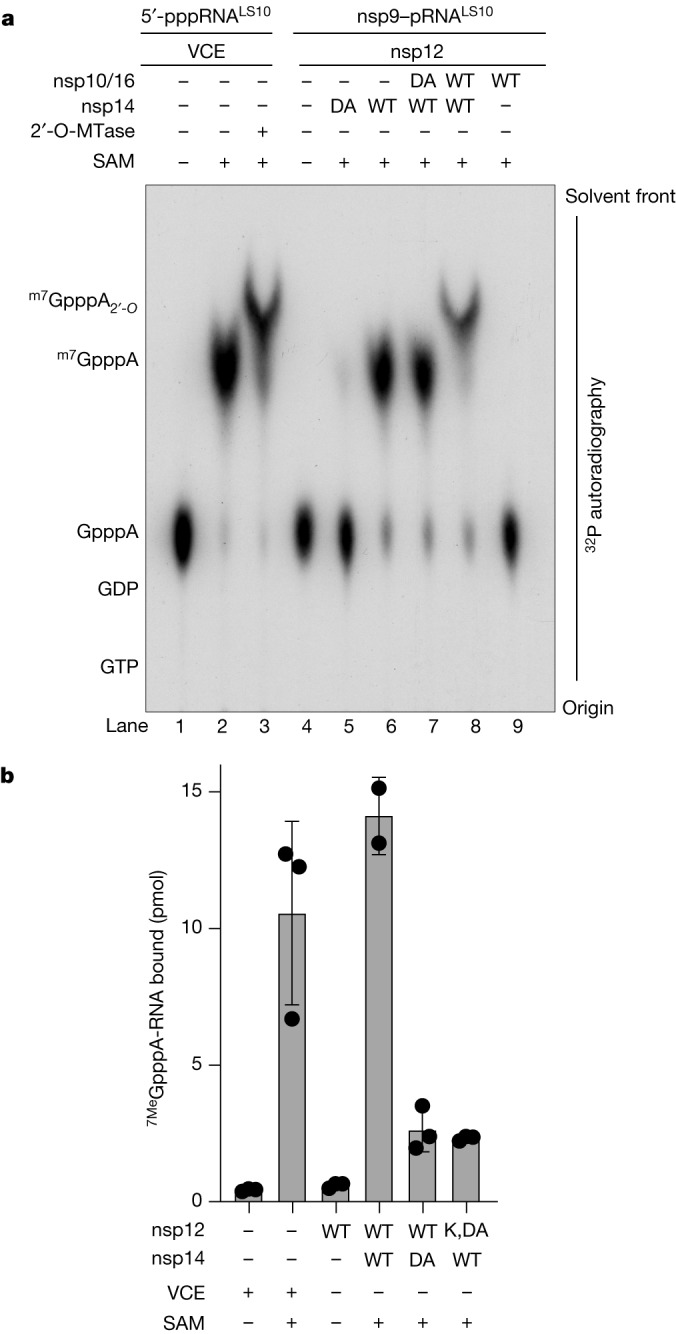
Fig. 4. nsp14 and nsp16 catalyse the formation of the cap-0 and cap-1 structures.

a, TLC analysis of the reaction products from Extended Data Fig. 6a, after extraction from the urea–PAGE gel and treatment with P1 nuclease and CIP. The location of the cold standards (left) was visualized by ultraviolet fluorescence and the reaction products were visualized by 32P autoradiography. b, Pull-down assays depicting the binding of [32P]7MeGpppA-RNALS10 to GST–eIF4E. [32P]7MeGpppA-RNALS10 was produced using SARS-CoV-2 virally encoded proteins or the VCE. Radioactivity in GST pull-down assays was quantified by scintillation counting. Data are mean ± s.d. The results shown in the figure are representative of three independent experiments. nsp14 DA, nsp14(D331A); nsp16 DA, nsp16(D130A).
